Asfiled with the Securities and Exchange Commission on October 29, 2008
UNITED STATES SECURITIES AND EXCHANGE COMMISSION
WASHINGTON, D.C. 20549
FORM 20-F
(Mark One)
| | | |
| o | | REGISTRATION STATEMENT PURSUANT TO SECTION 12(b) OR (g) OF THESECURITIES EXCHANGE ACT OF 1934 |
OR
| | | |
| þ | | ANNUAL REPORT PURSUANT TO SECTION 13 OR 15(d) OF THE SECURITIESEXCHANGE ACT OF 1934 |
For the fiscal year ended June 30, 2008
OR
| | | |
| o | | TRANSITION REPORT PURSUANT TO SECTION 13 OR 15(d) OF THESECURITIES EXCHANGE ACT OF 1934 |
OR
| | | |
| o | | SHELL COMPANY REPORT PURSUANT TO SECTION 13 OR 15(d) OF THESECURITIES EXCHANGE ACT OF 1934 |
Date of event requiring this shell company report
For the transition period from to
Commission file number: 001 – 31545
HARMONY GOLD MINING COMPANY LIMITED
(Exact name of registrant as specified in its charter)
REPUBLIC OF SOUTH AFRICA
(Jurisdiction of incorporation or organization)
RANDFONTEIN OFFICE PARK, CNR WARD AVENUE AND MAIN REEF ROAD,
RANDFONTEIN, SOUTH AFRICA, 1760
(Address of principal executive offices)
Khanya Maluleke, Company Secretary
tel: +27 11 411 2019, khanya.maluleke@harmony.co.za, fax: +27 11 411 2070,
Randfontein Office Park, CNR Ward Avenue and Main Reef Road, Randfontein, South Africa, 1760
(Name, Telephone, E-mail and/or Facsimile number and Address of Company Contact Person)
Securities registered or to be registered pursuant to Section 12(b) of the Act:
Ordinary shares, with nominal value Rand 50 cents per share*
(Title of Class)
American Depositary Shares (as evidenced by American Depositary Receipts),
each representing one ordinary share
(Title of Class)
Securities registered or to be registered pursuant to Section 12(g) of the Act:
Ordinary shares, with nominal value Rand 50 cents per share*
(Title of Class)
American Depositary Shares (as evidenced by American Depositary Receipts),
each representing one ordinary share
(Title of Class)
| * | | Not for trading, but only in connection with the registration ofAmerican Depositary Shares, pursuant to the requirements of theSecurities and Exchange Commission. |
Securities for which there is a reporting obligation pursuant to Section 15(d) of the Act: None
The number of outstanding shares of each of the issuer’s classes of capital or common stock as ofthe close of the last full fiscal year covered by this Annual Report was:
403,253,756 ordinary shares, with nominal value of Rand 50 cents per share
Indicate by check mark if the registrant is a well-known seasoned issuer, as defined in Rule 405 ofthe Securities Act.
YES þ NO o
If this report is an annual or transition report, indicate by check mark if the registrant is notrequired to file reports pursuant to Section 13 or 15(d) of the Securities Exchange Act of 1934.
YES o NO þ
Indicate by check mark whether the registrant (1) has filed all reports required to be filed bySection 13 or 15(d) of the Securities Exchange Act of 1934 during the preceding 12 months (or forsuch shorter period that the registrant was required to file such reports) and (2) has been subjectto such filing requirements for the past 90 days:
YES þ NO o
Indicate by check mark whether the registrant is a large accelerated filer, an accelerated filer,or a non-accelerated filer. See definition of “accelerated filer and large accelerated filer” inRule 12b-2 of the Exchange Act. (Check one):
| | | | | |
| Large accelerated filer þ | | Accelerated filer o | | Non-accelerated filer o |
Indicate by check mark which basis of accounting the registrant has used to prepare the financialstatements included in this filing:
| | | | | |
| U.S. GAAP o | | International financial Report Standards as
issued | | Other o |
| | | by the International Accounting Standards
Board þ | | |
If “Other” has been checked in response to the previous question, indicate by check mark whichfinancial statement item the registrant has elected to follow:
Item 17 o Item 18 þ
If this is an annual report, indicate by check mark whether the registrant is a shell company (asdefined in Rule 12b-2 of the Exchange Act).
YES o NO þ
Indicate by check mark whether the registrant has filed all documents and reports required to befiled by Sections 12, 13 or 15(d) of the Securities Exchange Act of 1934 subsequent to thedistribution of securities under a plan confirmed by a court.
YES þ NO o
USE OF TERMS AND CONVENTIONS IN THIS ANNUAL REPORT
Harmony Gold Mining Company Limited is a corporation organized under the laws of theRepublic of South Africa. As used in this Annual Report on Form 20-F, or this annual report, unlessthe context otherwise requires, the term “Harmony” refers to Harmony Gold Mining Company Limited;the term “South Africa” refers to the Republic of South Africa; the terms “we”, “us” and “our”refer to Harmony and, as applicable, its direct and indirect subsidiaries as a “Group”; the terms“South African government” and “Government” refer to the government of South Africa and, where thecontext requires, include the South African state.
In this annual report, references to “R”, “Rand” and “c”, “cents” are to the SouthAfrican Rand, the lawful currency of South Africa, “A$” refers to Australian dollars, “Kina” or “K”refers to Papua New Guinean Kina and references to “$”, “U.S.$” and “U.S. dollars” are to UnitedStates dollars.
This annual report contains information concerning our gold reserves. While this annualreport has been prepared in accordance with the regulations contained in Securities and ExchangeCommission Guide 7, it is based on assumptions which may prove to be incorrect. See Item 3. “KeyInformation — Risk Factors — Harmony’s gold reserve figures are estimated based on a number ofassumptions, including assumptions as to mining and recovery factors, future cash costs orproduction and the price of gold and may yield less gold under actual production conditions thancurrently estimated.”
This annual report contains descriptions of gold mining and the gold mining industry,including descriptions of geological formations and mining processes. We have explained some ofthese terms in the Glossary of Mining Terms included at the end of this annual report. Thisglossary may assist you in understanding these terms.
PRESENTATION OF FINANCIAL INFORMATION
We are a South African company and the majority of our operations are located in our homecountry. Accordingly, our books of account are maintained in South African Rand and our annual andinterim financial statements are prepared in accordance with International Financial ReportingStandards (“IFRS”) as issued by the International Accounting Standards Board (“IASB”). Prior tofiscal year ended June 30, 2008, our annual financial statements(translated into U.S. dollars) were prepared and filed with the U.S.Securities and Exchange Commission (“SEC”) in accordancewith generally accepted accounting principles in the United States(“U.S. GAAP”). On December 21, 2007, the SECadopted rules allowing foreign private issuers that file Annual Reports on Form 20-F to filefinancial statements with the SEC in accordance with IFRS as issued by the IASB withoutreconciliation to U.S. GAAP. As per these new rules, we changed ourbasis of presentation and included in this annual report ourconsolidated financial statements prepared in accordance with IFRS as issued by the IASB,translated into U.S. dollars. All financial information, except as otherwise noted, are stated inaccordance with IFRS as issued by the IASB.
In this annual report, we also present “total cash costs” and “total cash costs per ounce”,which have been determined using industry standards promulgated by the Gold Institute and arenon-GAAP measures. The Gold Institute was a non-profit international industry association ofminers, refiners, bullion suppliers and manufacturers of gold products that ceased operation in2002, which developed a uniform format for reporting production costs on a per ounce basis. TheGold Institute has now been incorporated into the National Mining Association. The guidance wasfirst adopted in 1996 and subsequently revised in November 1999. An investor should not considerthese items in isolation or as alternatives to production costs, cost of sales or any other measureof financial performance presented in accordance with IFRS as issued by the IASB. While the GoldInstitute has provided definitions for the calculation of total cash costs, the calculation oftotal cash costs and total cash costs per ounce may vary significantly among gold mining companiesand, by themselves, do not necessarily provide a basis for comparison with other gold miningcompanies. For further information, see Item 5. “Operating and Financial Review andProspects — Costs — Reconciliation of Non-GAAP Measures”.
We have included the U.S. dollar equivalent amounts of certain information and transactions inRand, Kina and A$. Unless otherwise stated, we have translated (i) balance sheet items at the noonbuying rate of the Federal Reserve Bank of New York on the last business day of the period (R7.80per U.S.$1.00 as at June 30, 2008 and R7.04 per U.S.$1.00 as at June 30, 2007), (ii) acquisitions,disposals and specific items included within equity at the rate prevailing at the date thetransaction was entered into and (iii) income statement items at the average rate for the year(R7.26 per U.S.$1.00 for fiscal 2008, R7.20 per U.S.$1.00 for fiscal 2007, and R6.36 per U.S.$1.00for fiscal 2006). Capital expenditures for fiscal 2009 have been translated at the rates used forbalance sheet items. By including these U.S. dollar equivalents in this annual report, we are notrepresenting that the Rand, Kina and A$ amounts actually represent the U.S. dollar amounts, as thecase may be, or that these amounts could be converted at the rates indicated.
3
FORWARD-LOOKING STATEMENTS
This annual report contains forward-looking statements within the meaning of the UnitedStates Private Securities Litigation Reform Act of 1995 with respect to our financial condition,results of operations, business strategies, operating efficiencies, competitive positions, growthopportunities for existing services, plans and objectives of management, markets for stock andother matters. In particular, among other statements, certain statements in Item 4. “Informationon the Company,” Item 5. “Operating and Financial Review and Prospects” and Item 11. “Quantitativeand Qualitative Disclosures About Market Risk” are forward-looking in nature. Statements in thisannual report that are not historical facts are “forward-looking statements” for the purpose of thesafe harbor provided by Section 21E of the Securities Exchange Act of 1934, as amended (the“Exchange Act”), and Section 27A of the Securities Act of 1933, as amended.
These forward-looking statements, including, among others, those relating to our futurebusiness prospects, revenues and income, wherever they may occur in this annual report and theexhibits to this annual report, are necessarily estimates reflecting the best judgment of oursenior management and involve a number of risks and uncertainties that could cause actual resultsto differ materially from those suggested by the forward-looking statements. As a consequence,these forward-looking statements should be considered in light of various important factors,including those set forth in this annual report. Important factors that could cause actual resultsto differ materially from estimates or projections contained in the forward-looking statementsinclude, without limitation:
| | • | | overall economic and business conditions in South Africa and elsewhere; |
| |
| | • | | the ability to achieve anticipated efficiencies and other cost savings in connection withpast and future acquisitions; |
| |
| | • | | fluctuations in the market price of gold; |
| |
| | • | | the occurrence of hazards associated with underground and surface gold mining; |
| |
| | • | | the occurrence of labor disruptions; |
| |
| | • | | availability, terms and deployment of capital; |
| |
| | • | | changes in government regulation, particularly mining rights and environmental regulation; |
| |
| | • | | fluctuations in exchange rates; |
| |
| | • | | currency devaluations/appreciations and other macroeconomic monetary policies; and |
| |
| | • | | socio-economic instability in South Africa and other countries in which we operate. |
We undertake no obligation to update publicly or release any revisions to theseforward-looking statements to reflect events or circumstances after the date of this annual reportor to reflect the occurrence of unanticipated events.
4
PART I
Item 1. IDENTITY OF DIRECTORS, SENIOR MANAGEMENT AND ADVISORS
Not applicable.
Item 2. OFFER STATISTICS AND EXPECTED TIMETABLE
Not applicable.
Item 3. KEY INFORMATION
SELECTED FINANCIAL DATA
The selected consolidated financial data below should be read in conjunction with, andare qualified in their entirety by reference to, our consolidated financial statements and thenotes thereto and with Item 5. “Operating and Financial Review and Prospects”, both includedelsewhere in this annual report. Historical results are not necessarily indicative of results to beexpected for any future period.
SELECTED HISTORICAL CONSOLIDATED FINANCIAL DATA
Weare a South African company and the majority of our operations arelocated in our home country. Accordingly, our books of account aremaintained in South African Rand and our annual and interim financialstatements are prepared in accordance with IFRS as issued by theIASB. Prior to fiscal year ended June 30, 2008, our annualfinancial statements (translated into U.S. dollars) were prepared andfiled with the SEC in accordance with U.S. GAAP. On December 21,2007, the SEC, adopted rules allowing foreign private issuers thatfile Annual Reports on Form 20-F to file financial statementswith the SEC in accordance with IFRS as issued by the IASB withoutreconciliation to U.S. GAAP. As per these new rules, we changed ourbasis of presentation and have included in this annual report ourconsolidated financial statements prepared in accordance with IFRS asissued by the IASB, translated into U.S. dollars.
The selected historical consolidated financial data for the last five fiscalyears are, unless otherwise noted, stated in accordance with IFRS asissued by the IASB, and has been extracted from the more detailedinformation and financial statements prepared in accordance with IFRSas issued by the IASB, including ouraudited consolidated financial statements as of June 30, 2008 and 2007 and for each of the years inthe three years ended June 30, 2008 and the related notes, which appear elsewhere in this annualreport. The historical consolidated financial data at June 30, 2006, 2005 and 2004, and for each ofthe years in the two years ended June 30, 2005, has been extracted from our audited consolidatedfinancial statements not included in this annual report as adjusted for discontinued operations andthe accounting changes described below.
During fiscal 2008, we early adopted IAS 23 (Revised) — Borrowing Costs. In accordancewith the Revised Standard’s transitional provisions, we designated July 1, 2000 (the earliestcommencement date of current qualifying projects) as the effective date and applied therequirements of the Revised Standard to all qualifying projects for which the commencement date ofcapitalization was on or after that date.
During fiscal 2008, we classified the assets and liabilities of the Cooke operation as heldfor sale and also classified the results of this operation as discontinued operations for allperiods presented below in the selected historical financial data. Discontinued operations alsoinclude the results of the Orkney and Australian operations that were classified as held for saleand discontinued operations during fiscal 2007. These reclassifications were done in terms of IFRS5 — Non-Current Assets held for sale and Discontinued Operations. See note 14 of the consolidatedfinancial statements and Item 4. “Information of the Company — Business — InternationalOperations”, “Information of the Company — Business — Orkney Operations” and Item 4. “Informationof the Company — Business — Cooke Operations”.
| | | | | | | | | | | | | | | | | | | | | |
| | | Fiscal year ended June 30, |
| | | 2008 | | 2007 | | 2006 | | 2005 | | 2004 |
| | | | | | | ($ in millions, except per share amounts) | | | | |
Income Statement Data | | | | | | | | | | | | | | | | | | | | |
Revenue | | | 1,269 | | | | 1,116 | | | | 937 | | | | 953 | | | | 955 | |
Operating profit/(loss) | | | 73 | | | | 154 | | | | (104 | ) | | | (322 | ) | | | (73 | ) |
Loss from associates | | | (11 | ) | | | (3 | ) | | | (17 | ) | | | — | | | | — | |
(Loss)/profit fromcontinuing operations beforetaxation | | | (39 | ) | | | 156 | | | | (91 | ) | | | (517 | ) | | | (3 | ) |
Taxation | | | (65 | ) | | | (39 | ) | | | (22 | ) | | | 87 | | | | 1 | |
(Loss)/profit fromcontinuing operations | | | (104 | ) | | | 117 | | | | (113 | ) | | | (430 | ) | | | (2 | ) |
Profit/(loss) fromdiscontinued operations | | | 74 | | | | (66 | ) | | | 22 | | | | (70 | ) | | | (35 | ) |
Net (loss)/profit | | | (30 | ) | | | 51 | | | | (91 | ) | | | (500 | ) | | | (37 | ) |
5
| | | | | | | | | | | | | | | | | | | | | |
| | | Fiscal year ended June 30, |
| | | 2008 | | 2007 | | 2006 | | 2005 | | 2004 |
| | | | | | | ($ in millions, except per share amounts) | | | | |
Basic (loss)/earnings pershare from continuingoperations ($) | | | (0.26 | ) | | | 0.29 | | | | (0.29 | ) | | | (1.19 | ) | | | (0.01 | ) |
Diluted (loss)/earnings pershare from continuingoperations ($) | | | (0.26 | ) | | | 0.29 | | | | (0.29 | ) | | | (1.19 | ) | | | (0.01 | ) |
Basic (loss)/earnings pershare ($) | | | (0.08 | ) | | | 0.12 | | | | (0.23 | ) | | | (1.38 | ) | | | (0.15 | ) |
Diluted (loss)/earnings pershare ($) | | | (0.08 | ) | | | 0.12 | | | | (0.23 | ) | | | (1.38 | ) | | | (0.15 | ) |
Weighted average number ofshares used in thecomputation of basic(loss)/earnings per share | | | 400,750,167 | | | | 397,910,797 | | | | 393,727,012 | | | | 361,816,512 | | | | 253,558,000 | |
Weighted average number ofshares used in thecomputation of diluted(loss)/earnings per share | | | 402,894,248 | | | | 402,382,011 | | | | 393,727,012 | | | | 361,817,512 | | | | 254,888,334 | |
Dividends per share | | | — | | | | — | | | | — | | | | 0.05 | | | | 0.10 | |
| | | | | | | | | | | | | | | | | | | | |
Other Financial Data | | | | | | | | | | | | | | | | | | | | |
Cash cost per ounce of goldfrom continuing operations($/oz) (1) | | | 591 | | | | 479 | | | | 440 | | | | 383 | | | | 339 | |
Total cash cost per ounce ofgold ($/oz) (1) | | | 589 | | | | 486 | | | | 436 | | | | 379 | | | | 333 | |
| | | | | | | | | | | | | | | | | | | | | |
| | | June 30, |
| | | 2008 | | 2007 | | 2006 | | 2005 | | 2004 |
| | | ($ in millions) |
Balance Sheet Data | | | | | | | | | | | | | | | | | | | | |
Assets | | | | | | | | | | | | | | | | | | | | |
Property, plant and equipment | | | 3,531 | | | | 3,484 | | | | 3,263 | | | | 3,385 | | | | 3,731 | |
Non-current assetsclassified as held for sale | | | 197 | | | | 182 | | | | — | | | | — | | | | — | |
Other assets | | | 982 | | | | 1,494 | | | | 1,432 | | | | 1,433 | | | | 1,256 | |
Total assets | | | 4,710 | | | | 5,160 | | | | 4,695 | | | | 4,818 | | | | 4,987 | |
| | | | | | | | | | | | | | | | | | | | |
Equity and liabilities | | | | | | | | | | | | | | | | | | | | |
Total equity | | | 3,172 | | | | 3,366 | | | | 3,249 | | | | 3,489 | | | | 3,464 | |
Borrowings (current andnon-current) | | | 525 | | | | 653 | | | | 500 | | | | 563 | | | | 461 | |
Other liabilities | | | 1,013 | | | | 1,141 | | | | 946 | | | | 766 | | | | 1,062 | |
Total equity and liabilities | | | 4,710 | | | | 5,160 | | | | 4,695 | | | | 4,818 | | | | 4,987 | |
| | |
| (1) | | Total cash costs and total cash costs per ounce arenon-GAAP measures. We have calculated cash costs per ounceby dividing total cash costs, as determined using theguidance provided by the Gold Institute, by gold ouncessold for all periods presented. The Gold Institute was anon-profit industry association comprised of leading goldproducers, refiners, bullion suppliers and manufacturers.This institute has now been incorporated into the NationalMining Association. The guidance was first issued in 1996and was revised in November 1999. Total cash costs, asdefined in the guidance provided by the Gold Institute,include mine production costs, transport and refinerycosts, applicable general and administrative costs, costsassociated with movements in production inventories and orestockpiles, ongoing environmental rehabilitation costs aswell as transfers to and from deferred stripping and costsassociated with royalties. |
6
| | |
| | | Ongoing employee terminationcosts are included, however, employeetermination costsassociated with major restructuring and shaft closures areexcluded. Total cash costs have been calculated on aconsistent basis for all periods presented. Changes in cashcosts per ounce are affected by operational performance, aswell as changes in the currency exchange rate between theRand and the U.S. dollar. Because total cash costs andtotal cash costs per ounce are non-GAAP measures, theyshould therefore not be considered by investors inisolation or as an alternative to production costs, cost ofsales, or any other measure of financial performancecalculated in accordance with IFRS as issued by the IASB.While the Gold Institute has provided a definition for thecalculation of total cash costs and total cash costs perounce, the calculation of cash costs per ounce may varyfrom company to company and may not be comparable to othersimilarly titled measures of other companies. However, webelieve that cash costs per ounce is a useful indicator toinvestors and management of a mining company’s performanceas it provides (1) an indication of the cash generatingcapacities of the mining operations, (2) the trends in cashcosts as the company’s operations mature, (3) a measure ofa company’s performance, by comparison of cash costs perounce to the spot price of gold and (4) an internalbenchmark of performance to allow for comparison againstother companies. For further information, see Item 5.“Operating and Financial Review and Prospects — Costs —Reconciliation of non-GAAP measures”. |
7
EXCHANGE RATES
Unless otherwise stated, balance sheet item amounts are translated from Rand to U.S.dollars at the exchange rate prevailing on the last business day of the period (R7.80 per U.S.$1.00as at June 30, 2008), except for acquisitions, disposals and specific items included within equitythat are converted at the exchange rate prevailing on the date the transaction was entered into,and income statement item amounts that are translated from Rand to U.S. dollars at the averageexchange rate for the period (R7.26 per U.S.$1.00 for fiscal 2008).
Asof October 21, 2008, the noon buying rate of the Federal Reserve Bank of New York perU.S.$1.00 was R10.67.
The following table sets forth, for the past five fiscal years, the average and periodend noon buying rates in New York City for cable transfers in Rand and, for the past six months,the high and low noon buying rates in New York City for cable transfers in Rand, in each case, ascertified for customs purposes by the Federal Reserve Bank of New York for Rand expressed in Randper U.S.$1.00.
| | | | | | | | | |
| Fiscal Year Ended | | | | |
| June 30, | | Average(1) | | Period End |
2004 | | | 6.89 | | | | 6.23 | |
2005 | | | 6.18 | | | | 6.67 | |
2006 | | | 6.36 | | | | 7.17 | |
2007 | | | 7.20 | | | | 7.04 | |
2008 | | | 7.26 | | | | 7.80 | |
| | | | | | | | | |
| Month of | | High | | Low |
May 2008 | | | 7.76 | | | | 7.47 | |
June 2008 | | | 8.12 | | | | 7.70 | |
July 2008 | | | 7.92 | | | | 7.31 | |
August 2008 | | | 7.90 | | | | 7.24 | |
September 2008 | | | 8.28 | | | | 7.77 | |
October 2008(through October 21, 2008) | | | 10.67 | | | | 8.27 | |
| | |
| (1) | | The average of the noon buying rates provided by theFederal Reserve Bank of New York on the last day of eachfull month during the relevant period. |
Fluctuations in the exchange rate between Rand and the U.S. dollar will affect the dollarequivalent of the price of ordinary shares on the Johannesburg Stock Exchange, which may affect themarket price of the ADSs on the New York Stock Exchange. These fluctuations will also affect thedollar amounts received by owners of ADSs on the conversion of any dividends paid in Rand onordinary shares.
8
CAPITALIZATION AND INDEBTEDNESS
Not applicable.
9
REASONS FOR THE OFFER AND USE OF PROCEEDS
Not applicable.
10
RISK FACTORS
In addition to the other information included in this annual report and the exhibits, youshould also carefully consider the following factors related to our ordinary shares and ADSs. Theremay be additional risks that we do not currently know of or that we currently deem immaterial basedon information currently available to us. Any of these risks could have a materially adverse effecton our business, financial condition or results of operations, leading to a decline in the tradingprice of our ordinary shares or our ADSs. The risks described below may, in retrospect, turn out tobe incomplete and therefore may not be the only risks to which we are exposed. Additional risks anduncertainties not presently known to us or that we now believe are immaterial, could also adverselyaffect our businesses, results of operations or financial condition. The order of presentation ofthe risk factors below does not indicate the likelihood of their occurrence or the magnitude or thesignificance of the individual risks. The risks described below could occur individually orcumulatively and intensify in case of a cumulative occurrence.
Risks Relating to Our Business and the Gold Mining Industry
The profitability of our operations, and the cash flows generated by those operations, are affectedby changes in the Rand price of gold, such that a fall in the price of gold below our cash cost ofproduction for any sustained period may lead us to experience losses and to curtail or suspendcertain operations.
Substantially all of our revenues come from the sale of gold. Historically, the marketprice for gold has fluctuated widely and has been affected by numerous factors over which we haveno control, including:
| | • | | the demand for gold for industrial uses and for use in jewelry; |
| |
| | • | | international or regional political and economic trends; |
| |
| | • | | the strength or weakness of the U.S. dollar (the currency in whichgold prices generally are quoted) and of other currencies; |
| |
| | • | | financial market expectations regarding the rate of inflation; |
| |
| | • | | interest rates; |
| |
| | • | | speculative activities; |
| |
| | • | | actual or expected purchases and sales of gold bullion held by centralbanks or other large gold bullion holders or dealers; |
| |
| | • | | forward sales by other gold producers; and |
| |
| | • | | the production and cost levels for gold in major gold-producingnations, such as South Africa, China, the United States and Australia. |
In addition, the current demand for and supply of gold affects the price of gold, but notnecessarily in the same manner as current demand and supply affect the prices of other commodities.Historically, gold has retained its value in relative terms against basic goods in times ofinflation and monetary crisis. As a result, central banks, financial institutions and individualshold large amounts of gold as a store of value and production in any given year constitutes a verysmall portion of the total potential supply of gold. Since the potential supply of gold is largerelative to mine production in any given year, normal variations in current production will notnecessarily have a significant effect on the supply of gold or its price.
11
The volatility of gold prices is illustrated in the following table, which shows theannual high, low and average of the afternoon London Bullion Market fixing price of gold inU.S. dollars for the past ten calendar years:
| | | | | | | | | | | | | |
| | | | | | | Price per ounce | | |
| | | High | | Low | | Average |
| Calendar Year | | ($) | | ($) | | ($) |
1998 | | | 313 | | | | 273 | | | | 294 | |
1999 | | | 326 | | | | 253 | | | | 279 | |
2000 | | | 313 | | | | 264 | | | | 282 | |
2001 | | | 293 | | | | 256 | | | | 271 | |
2002 | | | 332 | | | | 278 | | | | 309 | |
2003 | | | 412 | | | | 322 | | | | 361 | |
2004 | | | 427 | | | | 343 | | | | 389 | |
2005 | | | 476 | | | | 411 | | | | 434 | |
2006 | | | 725 | | | | 525 | | | | 604 | |
2007 | | | 841 | | | | 608 | | | | 695 | |
2008(through October 21, 2008) | | | 1,011 | | | | 741 | | | | 775 | |
OnOctober 21, 2008, the afternoon fixing price of gold on the London Bullion Market wasU.S.$772.00 per ounce.
While the aggregate effect of these factors is impossible for us to predict, if goldprices should fall below our cash cost of production and remain at such levels for any sustainedperiod, we may experience losses and may be forced to curtail or suspend some or all of ouroperations. In addition, we would also have to assess the economic impact of low gold prices on ourability to recover any losses we may incur during that period and on our ability to maintainadequate reserves. Our cash cost per ounce of gold sold from continuing operations was U.S.$591 infiscal 2008, U.S.$479 in fiscal 2007 and U.S.$440 in fiscal 2006.
As the majority of our production costs are incurred in Rand and other non-U.S. currencies, andgold is sold in U.S. dollars, our financial condition could be materially harmed by an appreciationin the value of the Rand and other non-U.S. currencies against the U.S. dollar.
Gold is sold throughout the world in U.S. dollars, but most of our operating costs areincurred in Rand and other non-U.S. currencies. As a result, any significant and sustainedappreciation of the South African Rand or other non-U.S. currencies against the dollar will servematerially to reduce our revenues and overall net income.
Estimations of our gold reserves are based on a number of assumptions, including assumptions as tomining and recovery factors, future cash costs of production and the price of gold and may yieldless gold under actual production conditions than currently estimated.
The ore reserve estimates contained in this annual report are estimates of the milldelivered quantity and grade of gold in our deposits and stockpiles. They represent the amount ofgold which we believe can be mined, processed and sold at prices sufficient to recover ourestimated future cash costs of production, remaining investment and anticipated additional capitalexpenditures. Our ore reserves are estimated based upon a number of factors, which have been statedin accordance with SEC Industry Guide 7. Our ore reserve estimates are calculated based onestimates of:
| | • | | future cash costs (which in some cases are assumed to decrease significantly); |
| |
| | • | | future gold prices; and |
| |
| | • | | future currency exchange rates. |
These factors, which are beyond our control, significantly impact these ore reserveestimates. As a result, the reserve estimates contained in this annual report should not beinterpreted as assurances of the economic life of our gold and other precious metal deposits or thefuture profitability of operations.
12
Since these ore reserves are estimates based on assumptions related to the factorsdetailed above, should there be changes to these, we may in the future need to revise theseestimates. In particular, if our cash operating and production costs increase or do not decrease asassumed (whether in dollar, Rand, or other non-U.S. currencies terms, or in relative terms due to appreciation of the Randand other non-U.S. currencies against the U.S. dollar) or the gold price decreases, the recovery of a portion of our ore reservesmay become uneconomical. This will, in turn, will lead us to reduce our estimated reserves.
In order to maintain gold production beyond the expected lives of our existing mines or to increaseproduction materially above projected levels, we will need to access additional reserves throughexploration or discovery.
Our operations have limited proven and probable reserves and exploration and discovery isnecessary to maintain current gold production levels at these operations. Exploration for gold andother precious metals is speculative in nature, is frequently unsuccessful and involves many risks,including those related to:
| | • | | locating orebodies; |
| |
| | • | | identifying the metallurgical properties of orebodies; |
| |
| | • | | estimating the economic feasibility of mining orebodies; |
| |
| | • | | developing appropriate metallurgical processes; |
| |
| | • | | obtaining necessary governmental permits; and |
| |
| | • | | constructing mining and processing facilities at any site chosen for mining. |
Our exploration efforts might not result in the discovery of mineralization, and anymineralization discovered might not result in an increase in our proven and probable reserves. Toaccess additional reserves, we will need to successfully complete development projects, includingextensions to existing mines and, possibly, that of new mines. Development projects would also benecessary to access any new mineralization discovered through our exploration activities around theworld. We typically use feasibility studies to determine whether or not to undertake significantdevelopment projects. Feasibility studies include estimates of expected or anticipated economicreturns, which are based on assumptions about:
| | • | | future gold and other metal prices; |
| |
| | • | | anticipated tonnage, grades and metallurgical characteristics of ore to be mined and processed; |
| |
| | • | | anticipated recovery rates of gold and other metals from the ore, and |
| |
| | • | | anticipated total costs of the project, including capital expenditure and cash costs. |
Actual cash costs of production, production and economic returns may differ significantly fromthose anticipated by our feasibility studies for new development projects.
It can take a number of years from the initial feasibility study until development iscompleted and, during that time, the economic feasibility of production may change. In addition,there are a number of uncertainties inherent in the development and construction of an extension toan existing mine or any new mine, including:
| | • | | the availability and timing of necessary environmental and governmental permits; |
| |
| | • | | the timing and cost of constructing mining and processing facilities, which can be considerable; |
| |
| | • | | the availability and cost of skilled labor, power, water and other materials; |
| |
| | • | | the accessibility of transportation and other infrastructure, particularly in remote locations; |
| |
| | • | | the availability and cost of smelting and refining arrangements; and |
| |
| | • | | the availability of funds to finance construction and development activities. |
We currently maintain a range of focused exploration programs, concentrating on areas not toodistant from our operational mines, as well as a number of prospective known gold mineralizedregions around the world. During fiscal years 2008 and 2007, the bulk of exploration expenditurewas allocated to activities in South Africa, Papua New Guinea (“PNG”) and Australia. However, thereis no assurance that any future development projects will extend the life of our existing miningoperations or result in any new commercial mining operations.
13
The costs associated with the pumping of water inflows from closed mines adjacent to our operationscould adversely affect our results of operations.
Certain of our mining operations are located adjacent to the mining operations of other miningcompanies. A mine closure may have an adverse impact on the continued operations at an adjacentmine if appropriate preventative steps are not taken. In particular, this impact can include theingress of underground water where pumping operations at the closed mine are suspended. Suchingress could result in damage to property, operational disruptions and additional pumping costs,which would adversely affect any one of our adjacent mining operations.
The supply of electricity and increases in the cost of power may adversely affect our results ofoperations and our financial condition.
Each of our mining operations is dependent on a sufficient supply of electricity. Theelectricity supply was interrupted by the South African governmental entity, ESKOM, during fiscal2008 thereby halting production at certain of our mines. This led to management restructuringoperating processes to control and reduce our consumption of electricity at all our operations.Nevertheless, an insufficient supply of electricity may adversely affect our results of operationsand financial condition.
As a result of ESKOM’s planned capital expansion program to deal with the current powerconstraints, an increase in rates charged to consumers costs has been approved by the NationalEnergy Regulator South Africa (NERSA). More increases are anticipated in the future, which willalso be driven by increases in input costs, primarily coal. These increases will have a negativeimpact on our results of operations going forward.
As we currently do not enter into forward sales, commodity, derivatives or hedging arrangementswith respect to our future gold production, we are exposed to the impact of any significantdecrease in the gold price.
As a general rule, we sell our gold at the prevailing market price. Currently, wegenerally do not enter into forward sales, commodity, derivative or hedging arrangements toestablish a price in advance for the sale of future gold production, although we may do so in thefuture. As a result, we may realize the benefit of any short-term increase in the gold price, butare not protected against decreases in the gold price, and if the gold price decreasessignificantly, our revenues may be materially adversely affected.
We may experience problems in identifying, financing and managing new acquisitions and integratingthem with our existing operations.
Acquiring new gold mining operations involves a number of risks including:
| | • | | our ability to identify appropriate assets for acquisition and/or to negotiate acquisitions onfavorable terms; |
| |
| | • | | obtaining the financing necessary to complete future acquisitions; |
| |
| | • | | difficulties in assimilating the operations of the acquired business; |
| |
| | • | | difficulties in maintaining our financial and strategic focus while integrating the acquired business; |
| |
| | • | | problems in implementing uniform standards, controls, procedures and policies; |
| |
| | • | | increasing pressures on existing management to oversee a rapidly expanding company; and |
| |
| | • | | to the extent we acquire mining operations outside South Africa or Australasia, encounteringdifficulties relating to operating in countries in which we have not previously operated. |
Our ability to make successful acquisitions and any difficulties or time delays in achievingsuccessful integration of any of such acquisitions could have a material adverse effect on ourbusiness, operating results, financial condition and share price.
Certain factors may affect our ability to support the carrying value of our property, plant andequipment, goodwill and other assets on our balance sheet.
We review and test the carrying value of our assets on an annual basis when events or changesin circumstances suggest that the carrying amount may not be recoverable.
If there are indications that impairment may have occurred, we prepare estimates of expectedfuture cash flows for each group of assets. These estimates of future cash flows are prepared atthe lowest level for which identifiable cash flows are identified as being independent of the cashflows of other mining assets and liabilities. Expected future cash flows are inherently uncertain,and could materially change over time. Such cash flows are significantly affected by reserve andproduction estimates, together with economic factors such as spot and forward gold prices, discountrates, currency exchange rates, estimates of costs to produce reserves and future capitalexpenditures.
14
As of June 30, 2008, we have substantial amounts of property, plant and equipment, goodwilland other assets on our consolidated balance sheets. We have recorded impairment charges relatingto these assets and, if any one or a combination of the uncertainties described above occur,management may be required to recognize further impairment charges, which could adversely affectour financial results and condition.
Given the nature of mining and the type of gold mines we operate, we face a material risk ofliability, delays and increased cash costs of production from environmental and industrialaccidents and pollution.
The business of gold mining by its nature involves significant risks and hazards,including environmental hazards and industrial accidents. In particular, hazards associated withunderground mining include:
| | • | | Rock bursts; |
| |
| | • | | seismic events; |
| |
| | • | | underground fires; |
| |
| | • | | cave-ins or falls of ground; |
| |
| | • | | discharges of gases and toxic chemicals; |
| |
| | • | | release of radioactive hazards; |
| |
| | • | | flooding; |
| |
| | • | | pillar mining |
| |
| | • | | accidents; and |
| |
| | • | | other conditions resulting from drilling, blasting and the removal andprocessing of material from a deep-level mine. |
Hazards associated with open cast mining (also known as open-pit mining) include:
| | • | | flooding of the open-pit; |
| |
| | • | | collapse of the open-pit walls; |
| |
| | • | | accidents associated with the operation of large open-pits and rock transportation equipment; and |
| |
| | • | | accidents associated with the preparation and ignition of large-scale open-pit blasting operations. |
Hazards associated with waste-rock mining include:
| | • | | accidents associated with operating a waste dump and rock transportation; |
| |
| | • | | pillar mining; and |
| |
| | • | | production disruptions caused by weather. |
We are at risk of experiencing any or all of these environmental or other industrial hazards.The occurrence of any of these hazards could delay production, increase cash costs and result inour financial liability.
The nature of our mining operations presents safety risks.
The environmental and industrial risks identified above also present safety risks for ouroperations and our employees and can lead to the suspension and potential closure of operations forindeterminate periods. For example, in October 2007, an incident occurred at the Elandsrandoperation involving a compressed pipe column which broke off below the shaft surface bank and fellto the bottom of the men-and-material shaft, causing extensive damage to the shaft steel work andelectrical cables. The incident resulted in 3,000 workers being underground for more than 30 hours.Mining operations were temporarily suspended for 42 days to allow for repairs to be undertaken atthe shaft. These and other safety risks, even in situations where no injuries occur, can have amaterial adverse effect on our operations and production.
Our insurance coverage may prove inadequate to satisfy future claims against us.
We have third-party liability coverage for most potential liabilities, includingenvironmental liabilities. While we believe that our current insurance coverage for the hazardsdescribed above is adequate and consistent with industry practice, we may be subject to liabilityfor pollution (excluding sudden and accidental pollution) or other hazards against which we havenot insured or cannot insure, including those in respect of past mining
15
activities. Further, we maintain and intend to continue to maintain, property and liabilityinsurance consistent with industry practice, but such insurance contains exclusions and limitationson coverage. In addition, there can be no assurance that insurance will continue to be available ateconomically acceptable premiums. As a result, in the future, our insurance coverage may not coverthe extent of claims against us for environmental or industrial accidents or pollution.
Our operations may be negatively impacted by inflation.
Our operations have been materially affected by inflation in recent years. At June 30,2008, inflation in South Africa was 11.6%, a high level in recent years and may rise further. Inaddition, working costs and wages especially, have increased considerably over the past three yearsresulting in significant cost pressures for the mining industry. Our profits and financialcondition could also be affected adversely in the absence of a concurrent devaluation of the Randand an increase in the price of gold.
The socio-economic framework in the regions in which we operate may have an adverse effect on ouroperations and profits.
We have operations in South Africa and PNG. As a result, changes or instability to theeconomic or political environment in any of these countries or in neighboring countries couldaffect an investment in us. It is difficult to predict the future political, social and economicdirection in these countries, or any other country in which we operate, and the impact governmentdecisions may have on our business.
Actual and potential shortages of production inputs may have an adverse effect on our operationsand profits.
Our results of operations may be affected by the availability and pricing of rawmaterials and other essential production inputs. The price of raw materials may be substantiallyaffected by changes in global supply and demand, along with weather conditions, governmentalcontrols and other factors. A sustained interruption to the supply of any of these materials wouldrequire us to find acceptable substitute suppliers and could require us to pay higher prices forsuch materials. Any significant increase in the prices of these materials would increase ouroperating costs and affect production considerations.
Our financial flexibility could be materially constrained by exchange control regulations asimposed by the South African Reserve Bank (“SARB”).
In terms of South Africa’s exchange control regulations, the export of capital from SouthAfrica is restricted. As a result, our ability to raise and deploy capital outside South Africa islimited. In particular, we are:
| | • | | generally not permitted to export capital from South Africa, to hold foreigncurrency or incur indebtedness denominated in foreign currencies without theapproval of the South African exchange control authorities; |
| |
| | • | | generally not permitted to acquire an interest in a foreign venture without theapproval of the South African exchange control authorities and first havingcomplied with the investment criteria of the South African exchange controlauthorities; |
| |
| | • | | generally required to repatriate to South Africa profits of foreign operations; and |
| |
| | • | | limited in our ability to utilize profits of one foreign business to financeoperations of a different foreign business. |
These restrictions could hinder our normal corporate functioning, including our abilityto make foreign investments and procure foreign currency denominated financings in the future.
Since 1995, certain exchange controls in South Africa have been relaxed. The extent towhich the South African government may further relax such exchange controls cannot be predictedwith certainty, although the government has committed itself to a gradual approach to therelaxation of exchange control. Because South Africa has a fully floating exchange rate and aflexible interest rate policy, this could result in a rapid depreciation of the Rand exchange raterelative to world’s currencies which could serve to stem this withdrawal and could also result inan increase in interest rates due to the depreciation of the Rand.
We compete with mining and other companies for key human resources.
We compete with mining and other companies on a global basis to attract and retain key humanresources at all levels with the appropriate technical skills and operating and managerialexperience necessary to continue to operate our business. The global shortage of key miningindustry human resource skills, including geologists, mining engineers, metallurgists and skilledartisans has been exacerbated in the current environment of increased mining activity across theglobe. There can be no assurance that we will attract and retain skilled and
16
experienced employees and, should we lose any of our key personnel, our business may be harmed andour results of operations and financial condition could be adversely affected.
Since our South African labor force has substantial trade union participation, we face the risk ofdisruption from labor disputes and new South African labor laws.
Despite a history of positive and constructive engagement with labor unions, there areperiods during which the various stakeholders are unable to agree on dispute resolution processes.Disruptive activities on the part of labor, which normally differ in intensity, then becomeunavoidable. Due to the high level of union membership among our employees, we are at risk ofhaving, and have experienced in recent years, production stoppages for indefinite periods due tostrikes and other disputes. Significant labor disruptions have affected our operations andfinancial condition before and we are not able to predict whether or not we will experiencesignificant labor disputes in the future.
South African employment law sets out minimum terms and conditions of employment foremployees. Though these minimum terms and conditions may be improved by agreements between us andthe trade unions, the prescribed minimum terms and conditions forms the benchmark for allemployment contracts.
We are required to submit a report in terms of South African employment law detailing theprogress made towards achieving employment equity in the workplace. In the event this report is notsubmitted, we could incur substantial penalties.
Developments in South African employment law may increase our cash costs of production oralter our relationship with our employees and trade unions, which may have an adverse effect on ourbusiness, operating results and financial condition.
We may suffer adverse consequences as a result of our reliance on outside contractors to conductour operations.
A portion of our operations are currently conducted by outside contractors. As a result,our operations are subject to a number of risks, including:
| | • | | negotiating agreements with contractors on acceptable terms; |
| |
| | • | | the inability to replace a contractor and its operating equipment in the event that eitherparty terminates the agreement; |
| |
| | • | | reduced control over those aspects of operations which are the responsibility of the contractor; |
| |
| | • | | failure by a contractor to perform in terms of its agreement with us; |
| |
| | • | | interruption of operations in the event that a contractor ceases to operate due to insolvencyor other unforeseen events; |
| |
| | • | | failure of a contractor to comply with applicable legal and regulatory requirements, to theextent it is responsible for such compliance; and |
| |
| | • | | contractor’s problems regarding management of its workforce, labor unrest or other employmentissues. |
In addition, we may incur liability to third parties as a result of the actions of itscontractors. The occurrence of one or more of these risks could have a material adverse effect onour business, operational results and financial condition. See “Directors, Senior Management andEmployees—Employees.”
HIV& AIDS poses risks to us in terms of productivity and costs.
Theincidence of HIV & AIDS in South Africa and PNG, which is forecast to increase over thenext decade, poses risks to us in terms of potentially reduced productivity, and increased medicaland other costs. If a significant increase in the incidence of HIV& AIDS infection and HIV & AIDS-related diseases among the workforce over the next several years occurs, this may have anadverse impact on our operations, projects and financial status.
The cost of occupational healthcare services may increase in the future.
Our operations in South Africa are subject to health and safety regulations which couldimpose significant costs and burdens. The present Mine Health and Safety Act 29 of 1996 (“MineHealth and Safety Act”) imposes various duties on us at our mines, and grants the authorities broadpowers to, among other things, close unsafe mines and order corrective action relating to healthand safety matters.
17
The Occupational Diseases in Mines and Works Act 78 of 1973, or the Occupational DiseasesAct, governs the payment of compensation and medical costs related to certain illnesses contractedby persons employed in mines or at sites where activities ancillary to mining are conducted.Occupational healthcare services are available to our employees from our existing healthcarefacilities in South Africa. There is a risk that the cost of providing such services could increasein future depending on changes in the nature of underlying legislation and the profile of ouremployees. This increased cost, should it transpire, is currently indeterminate. We have embarkedon a number of initiatives focused on improving the quality of life of our workforce, althoughthere can be no guarantee that such initiatives will not be adversely affected by increased costs.
Laws governing mineral rights affect our business.
We are governed by the South African Mineral and Petroleum Resources Development Act 2002(“MPRDA”). See “Regulation—Health and Safety Matters—South Africa” for a description of theprincipal objectives set out in the MPRDA.
Under the MPRDA, tenure over established mining operations is secured for up to 30 years(and renewable for periods not exceeding 30 years each thereafter), provided that mining companiesapply for new order mining rights over existing operations within five years of May 1, 2004 orbefore the existing right expires, whichever is the earlier date and fulfill requirements specifiedin the MPRDA and the Broad-Based Socio-Economic Empowerment Charter for the South African miningindustry (“Mining Charter”).
The Mining Charter was signed by government and stakeholders in October 2002, andcontains principles relating to the transfer, over a 10-year period, of 26% of South Africa’smining assets (as equity or attributable units of production) to Historically Disadvantaged SouthAfricans (“HDSAs”), as defined in the Mining Charter. An interim target of 15% HDSA participationover five years has also been set and to this end, the South African mining industry has committedto securing financing to fund participation by HDSAs in an amount of R100.0 billion within thefirst five years of the Mining Charter’s tenure. The Mining Charter provides for the review of theparticipation process after five years to determine what further steps, if any, are needed toachieve target participation of 26%. In order to measure progress in meeting the requirements ofthe Mining Charter, companies are required to complete a Scorecard, in which the levels ofcompliance with the objectives of the Mining Charter can be “ticked off” after five and ten years,respectively. The Mining Charter and Scorecard require programs for black economic empowerment andthe promotion of value-added production, such as jewelry-making and other gold fabrication, inSouth Africa. In particular, targets are set out for broad-based black economic empowerment in theareas of human resources and skills development; employment equity; procurement and beneficiation.In addition, the Mining Charter addresses socio-economic issues, such as migrant labor, minecommunity and rural development and housing and living conditions.
We actively carry out mining and exploration activities in all of our material mineralrights areas. All of our South African operations have been granted their mining licenses. Wewill be eligible to apply for new licenses over existing operations, provided that we comply withthe Mining Charter. We have taken steps to comply with the expected provisions of the MiningCharter, such as promoting value-added production, exploring black empowerment initiatives andincreasing worker participation. Failure to comply with the conditions of the mining licenses couldhave a material adverse effect on our operations and financial condition.
The MPRDA also makes reference to royalties payable to the South African state in termsof the envisaged Mineral and Petroleum Resources Royalty Bill which has not yet been enacted. Thefourth draft of the Mineral and Petroleum Resources Royalty Bill was tabled in the South Africangovernment on August 21, 2008 and provides for the payment of a royalty according to a formulabased on earnings before interest, tax and depreciation, after the deduction of capitalexpenditure. This rate is then applied to revenue to calculate the royalty amount due, with aminimum of 0.5% and a maximum of 5% for gold. It is estimated that the formula could translate toa royalty rate of more than 2% of gross sales in terms of current pricing assumptions. The latestproposal results in a large increase from the 1.5% rate proposed in the second draft in 2006. Theroyalty is to become effective on May 1, 2009, if the Bill is passed by the South Africangovernment in its current form. The introduction of the Mining and Petroleum Royalty Act will havean adverse impact on the profits generated by our operations in South Africa.
In PNG, the mining license for Hidden Valley was approved in March 2005. Once productionin PNG is commenced, our PNG mining operations will be subject to royalty payments to thegovernment of PNG. Should we desire to expand any of our initiatives in PNG operations intoadditional areas under exploration, these operations would need to convert the existing explorationlicenses prior to the start of mining, and that process could require landowner title approval.There can be no assurance that any approval would be received. Please also see “Regulation” forfurther information.
18
We are subject to extensive environmental regulations.
As a gold mining company, we are subject to extensive environmental regulation. We haveexperienced and expect to continue to experience increased cash costs of production arising fromcompliance with South African and PNG environmental laws and regulations. The MPRDA, certain otherenvironmental legislation and the administrative policies of the South African government regulatethe impact of our prospecting and mining operations on the environment.
Pursuant to these regulations, upon the suspension, cancellation, termination or lapsingof a prospecting permit or mining authorization in South Africa, we will remain liable forcompliance with the provisions of the MPRDA, including any rehabilitation obligations. Thisliability will continue until such time as the South African Department of Minerals and Energy(“DME”) certifies that we have complied with such provisions.
In the future, we may incur significant costs associated with complying with theincreasingly stringent requirements being imposed under new legislation and regulations. This mayinclude the need to increase and accelerate expenditure on environmental rehabilitation and toalter provisions for this expenditure, which could have a material adverse effect on our resultsand financial condition. We may also face increased environmental costs should other mines in thevicinity of our mines fail to meet their obligations with regard to the pumping or treatment ofwater.
The South African government has reviewed requirements imposed upon mining companies toensure environmental restitution. For example, following the introduction of an environmentalrights clause in South Africa’s constitution, a number of environmental legislative reformprocesses have been initiated. Legislation passed as a result of these initiatives has tended to bematerially more onerous than laws previously applied in South Africa. Examples of such legislationinclude the MPRDA, the South African National Nuclear Regulator Act 1999, the South AfricanNational Water Act of 1998 and the South African National Environmental Management Act 1998, whichinclude stringent “polluter-pays” provisions. The adoption of these or additional or morecomprehensive and stringent requirements, in particular with regard to the management of hazardouswaste, the pollution of ground and ground-water systems and the duty to rehabilitate closed mines,may result in additional costs and liabilities.
Our PNG operations are also subject to various laws and regulations relating to theprotection of the environment, which are similar in scope to those of South Africa.
Investors in the United States may have difficulty bringing actions, and enforcing judgments,against us, our directors and our executive officers based on the civil liabilities provisions ofthe federal securities laws or other laws of the United States or any state thereof.
We are incorporated in South Africa. Each of our directors and executive officers (andour independent registered public accounting firm) reside outside of the United States.Substantially all of the assets of these persons and substantially all of our assets are locatedoutside the United States. As a result, it may not be possible for investors to enforce a judgmentagainst these persons or ourselves obtained in a court of the United States predicated upon thecivil liability provisions of the federal securities or other laws of the United States or anystate thereof. A foreign judgment is not directly enforceable in South Africa, but constitutes acause of action which will be enforced by South African courts provided that:
| | • | | the court that pronounced the judgment had jurisdiction to entertain thecase according to the principles recognized by South African law withreference to the jurisdiction of foreign courts; |
| |
| | • | | the judgment is final and conclusive; |
| |
| | • | | the judgment has not lapsed; |
| |
| | • | | the recognition and enforcement of the judgment by South African courtswould not be contrary to public policy, including observance of the rulesof natural justice which require that the documents initiating the UnitedStates proceeding were properly served on the defendant and that thedefendant was given the right to be heard and represented by counsel in afree and fair trial before an impartial tribunal; |
| |
| | • | | the judgment does not involve the enforcement of a penal or revenue law; and |
| |
| | • | | the enforcement of the judgment is not otherwise precluded by theprovisions of the Protection of Business Act 99 of 1978, as amended, of theRepublic of South Africa. |
19
Compliance with new and changing corporate governance and public disclosure requirements addsuncertainty to our compliance policies and increases our costs of compliance.
Laws, regulations and standards relating to accounting, corporate governance and publicdisclosure, new SEC regulations and other listing regulations applicable to us are subject tochange and can create uncertainty for companies like us. New or changed laws, regulations and standards could lack specificity or besubject to varying interpretations. Their application in practice may evolve over time as newguidance is provided by regulatory and governing bodies. This could result in continuinguncertainty regarding compliance matters and higher costs of compliance as a result of ongoingrevisions to such governance standards.
Pursuant to Section 404 of the Sarbanes-Oxley Act of 2002, we are required to furnish areport by our management on our internal control over financial reporting. The report in thisannual report contains, among other matters, an assessment of the effectiveness of our internalcontrol over financial reporting as of the end of the fiscal year, including a statement as towhether or not our internal controls over financial reporting are effective. We are required tohave our independent registered public accounting firm publicly disclose their conclusionsregarding the evaluation.
During fiscal 2007, we identified certain material weaknesses in our internal controlsover financial reporting, in particular relating to the information technology control environmentand the financial reporting closing process which led to material adjustments being required in ourfinancial statements and which also negatively impacted the report issued by our independentregistered public accounting firm regarding our internal controls over financial reporting. We madeimprovements to our internal control over financial reporting during fiscal 2008 to mediate thesematerial weaknesses, and concluded that the controls related to the remediation of the materialweaknesses previously disclosed in the 2007 Annual Report on Form 20-F were designed, in place andoperating effectively for a sufficient period of time for management to determine that each of thematerial weaknesses was remediated as of June 30, 2008. See Item 15. “Disclosure Controls andProcedures”.
We are committed to maintaining high standards of corporate governance and publicdisclosure, and our efforts to comply with evolving laws, regulations and standards in this regardhave resulted in, and are likely to continue to result in, increased general and administrativeexpenses.
Investors may face liquidity risk in trading our ordinary shares on the JSE Limited.
The primary listing of our ordinary shares is on the JSE Limited. Historically, thetrading volumes and liquidity of shares listed on the JSE have been low relative to other majormarkets. The ability of a holder to sell a substantial number of our ordinary shares on the JSE ina timely manner, especially in a large block trade, may be restricted by this limited liquidity.See “The Offer and Listing—The Securities Exchange in South Africa.”
Because we have a significant number of outstanding share options and convertible debt instruments,our ordinary shares are subject to dilution.
We have employee share option schemes as well as other share schemes. The employee shareoption schemes came into effect in 1994, 2001 and 2003 respectively, and a new share scheme wasintroduced in 2006. Our Board has authorized up to 14% of the issued share capital to be used forthese plans. Additionally, we have convertible uncollaterized fixed rate bonds in the amount ofU.S.$208 million which are due on May 21, 2009. These bonds may be converted into equity at theoption of the bondholder at any time after July 1, 2004 and up to and including May 15, 2009 at aspecific conversion price based on the outstanding principal amount divided by the conversion pricein effect on that date. As a result, shareholders’ equity interests in us are subject to dilutionto the extent of the future exercises of the options, through share schemes and convertible debtinstruments.
20
Item 4. INFORMATION ON THE COMPANY
BUSINESS
History and Development
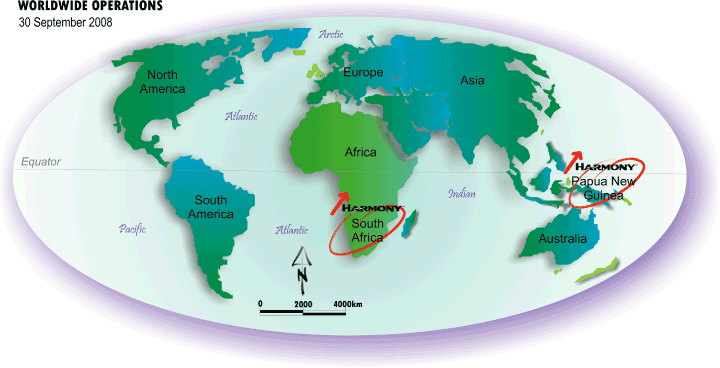
We conduct underground and surface gold mining and related activities, includingexploration, processing and smelting. We are currently the third largest producer of gold in SouthAfrica, producing approximately 23.4% of the country’s annual gold output, and we ranked among thetop 10 gold producers in the world, with operations and projects in South Africa and PNG. Our goldsales have increased from 650,312 ounces of gold in fiscal 1995 to approximately 1.9 million ouncesof gold in fiscal 2008. As at June 30, 2008, our mining operations reported total proven andprobable reserves of 50.5 million ounces, primarily from South African sources. In fiscal 2008, weprocessed approximately 25.4 million tons of ore.
In fiscal 2008, approximately 95% of our total gold production took place in SouthAfrica, and approximately 5% in Australasia. In fiscal 2008, approximately 93% of our South Africangold came from underground mines, and approximately 7% came from our surface operations (whichinclude Kalgold opencast operation and Phoenix operation). For more detailed information about ouractivities, see Item 4. “Information on the Company — Business — Harmony’s Mining Operations —Overview” and the notes to the consolidated financial statements included in this annual report.Mining is a highly regulated industry, and we operate under a variety of statutes and regulations.For more detailed information about these statutes and regulations, see Item 4. “Information on theCompany — Regulation” and Item 10. “Additional Information — Memorandum and Articles ofAssociation”.
The majority of our exploration and evaluation done during fiscal 2008 has been focusedon PNG. Our PNG exploration and evaluation opportunities are handled through the internationaloffice in Brisbane, Australia.
We were incorporated and registered as a public company in South Africa on August 25,1950 (under registration number 1950/038232/06). We poured our first gold on September 11, 1954. Inthe early 1970’s, we merged with the Anglovaal mines, Merriespruit and Virginia, forming HarmonyGold Mining Company Limited. In 1995, we were rejuvenated. We expanded from a single lease-boundmining operation into an independent, world-class gold producer. We acquired additional mineralrights in the Free State, Mpumalanga, Gauteng and North West provinces in South Africa when weacquired Lydex in 1997, Evander in 1998, Kalgold in 1999, Randfontein in 2000, ARMgold in 2003 andAvgold in 2004. In building our Australian portfolio, we acquired Hill 50 and New Hampton inWestern Australia in 2001 and 2002, respectively, and started our exploration portfolio in PNG withprojects in the Morobe province originally through our acquisition of Abelle in 2003. Duringfiscal 2008, we disposed of several operations in South Africa and Australia. See Item 4.“Disposals”.
Our principal executive offices are located at Randfontein Office Park, Corner of MainReef Road and Ward Avenue, Randfontein, 1760, South Africa and the telephone number at thislocation is +27-11-411-2000.
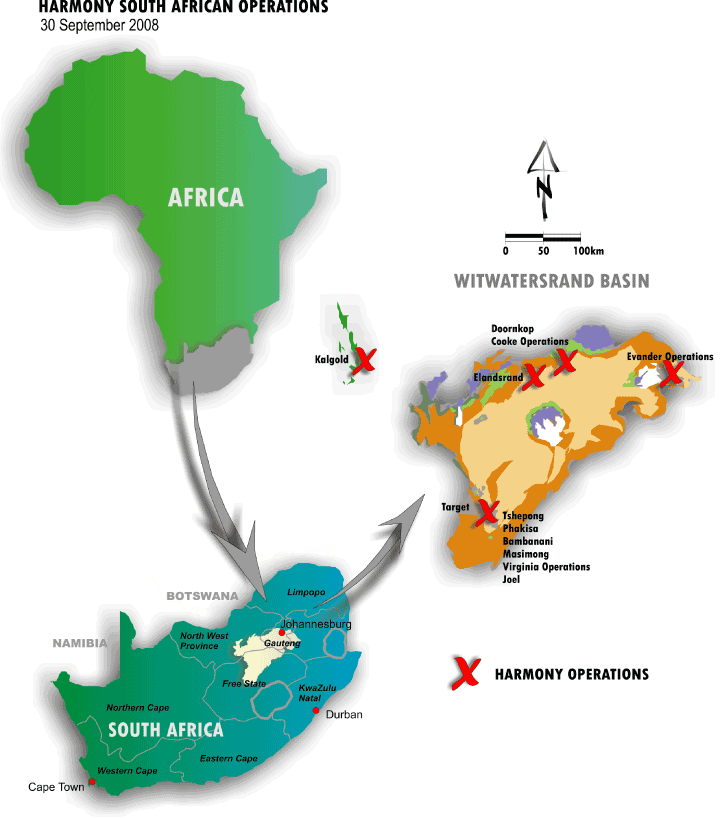
South African Operations
In South Africa, we operate a total of 11 underground operations, one open cast mine, andnine processing plants which are located in all of the currently known goldfields in theWitwatersrand basin of South Africa as well as the Green Stone belt. These operations produced 1.8million ounces in fiscal 2008, and South Africa represented approximately 94% (or 47.5 millionounces) of our total proven and probable reserves. The deep level gold are located in fourprovinces in this basin, being the Free State province, Mpumalanga, the West Rand Goldfields inGauteng province and the North West province. Surface operations are located in all these provincesas well.
Ore from the shafts and surface material are treated at nine metallurgical plants in SouthAfrica, located near the operations (four in the Free State province, two in the North Westprovince, one in Mpumalanga and two in Gauteng). There are two plants on care and maintenance whichcan be restarted if additional processing capacity is required (Joel and St. Helena plants in theFree State province).
As part of our “Back to Basics” strategy, management reassessed and restructured the manner inwhich operations are managed and evaluated. Each operation, consisting anywhere from a singleshaft to a group of shafts, is managed by a team headed up by a general manager. See Item 4.“Operational Strategy: Back to Basics” and “Harmony’s Management Structure”.
As a result of this reorganization, operations are classified as “Underground” or “Surface”,as opposed to the previous classification of “Growth”, “Quality”, “Leveraged” or “Surface”. Thereportable segments in South Africa are as follows:
21
| | • | | Tshepong, Phakisa, Bambanani, Doornkop, Elandsrand, Target, Evanderoperations, Masimong, Virginia operations and Cooke operations(classified as discontinued operations); and |
| |
| | • | | all other shafts and surface operations, including those that treathistoric sand dumps, rock dumps and tailings dams, are groupedtogether under “Other — Underground” or “Other — Surface”. |
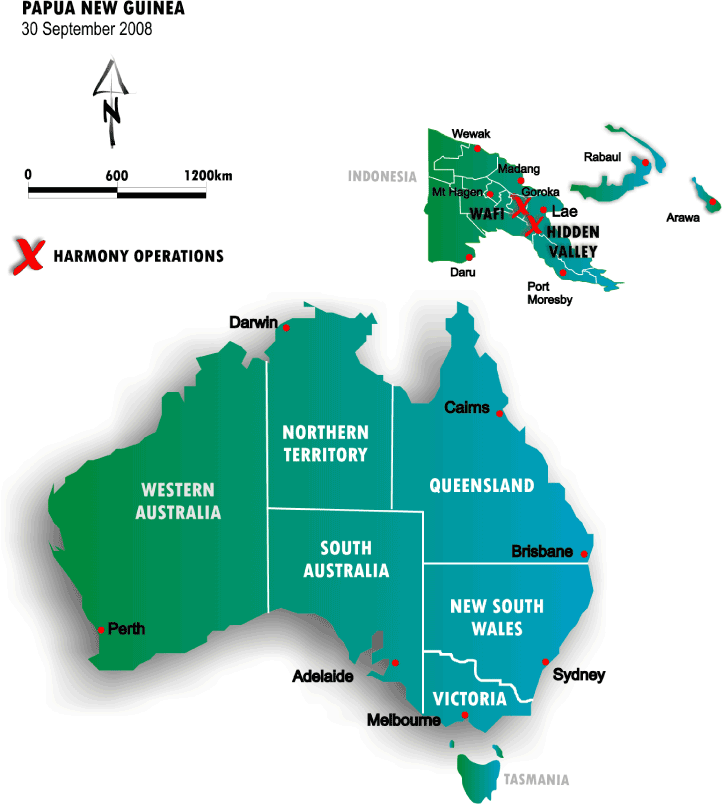
International Operations
Our interests internationally are currently mainly located in PNG and represent 6% (or 3.0million ounces) of our total proven and probable reserves.
Our interests in Australia now consist solely of one site located at Mt. Magnet inWestern Australia. This site has been closed down and the plant has been put on care andmaintenance since December 2007. The South Kalgoorlie operational assets and tenements, which wepreviously owned and which was also located in Western Australia, were sold to Dioro Exploration NL(“Dioro”) on November 30, 2007.
The Mt. Magnet operations produced 77,097 ounces in fiscal 2008, compared to 136,428 ounces infiscal 2007. The decrease was due to the mine being placed on care and maintenance in December2007. The South Kalgoorlie operations produced 27,778 ounces in fiscal 2008, compared to 88,371ounces in fiscal 2007. The results for 2008 are for the five months up to the sale to Dioro. Orefrom the underground and surface material were treated at the two metallurgical plants in Australia(one at Mt. Magnet and, prior to it being sold, at South Kalgoorlie). We classified the WesternAustralia operations as held for sale in April 2007. These operations also met the criteria to beclassified as discontinued operations.
In July 2007, we entered into an agreement with Dioro pursuant to which Dioro acquired ourSouth Kalgoorlie assets. The total purchase price was A$45 million (U.S.$39.8 million), consistingof both a cash and share component. The share component entailed the issuance of 11.4 million Dioroshares valued at A$20 million (U.S.$17.7 million), and a cash component of A$25 million (U.S.$22.1million). The transaction was subject to various conditions precedent, including a minimum capitalraising by Dioro of A$35 million (U.S.$30.9 million) by the completion date. On November 30, 2007,all conditions precedent were satisfied, and the transaction was completed and accounted for onthat date.
Duringfiscal 2008, we entered into an agreement with Monarch Gold MiningCompany (“Monarch Gold”) for the sale of our MountMagnet operations. The Mount Magnetoperations include Hill 50, Great Fingall, St George, Star and Big Bell mines, and comprises aresource inventory of 2.7 million ounces of gold, tenements covering approximately 62,000 hectares,166 exploration license blocks and a 2.7 million ton a yearcapacity plant. However, subsequent to year-end, we were advisedthat Monarch had placed itself in voluntary administration and, onAugust 1, 2008, the Administrator indicated that Monarch will notproceed with the proposed purchase and consequently the purchaseagreement has been terminated. We have since resumedmanagement of the Mt. Magnet operation which is still classified asheld for sale. See “Recent Developments”
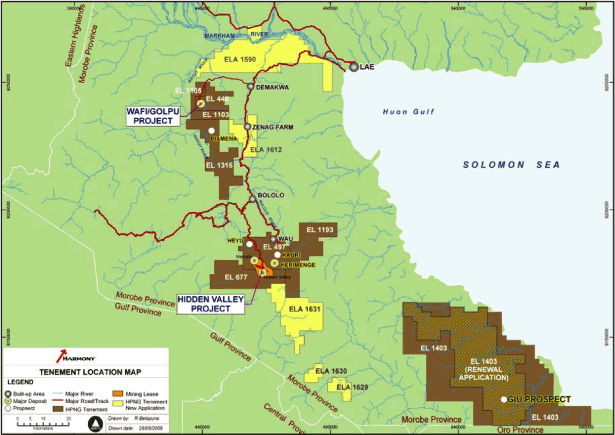
In PNG, we, through our wholly-owned PNG-based subsidiaries, Morobe Consolidated GoldfieldsLimited (“Morobe”) and Wafi Mining Limited (“Wafi”), own development and exploration prospects inthe Morobe Province. Following the end of fiscal 2008, Newcrest Mining Limited (“Newcrest”)acquired a 30.01% interest in our PNG assets and tenements (See “Recent Developments”). We, in ajoint venture with Newcrest, are in the process of building the Hidden Valley mine, with projectcompletion expected by the middle of calendar 2009.
In addition, we completed a number of stand alone pre-feasibility studies (“PFS”) inGolpu during the June 2007 quarter and in Wafi during the December 2007 quarter, which included theWafi gold resources and examined the development of three production scenarios:
| | • | | Golpu stand alone (an update of the Golpu PFS scenario); |
| |
| | • | | Golpu + Link Zone (high grade lenses within Zone B); and |
| |
| | • | | Golpu + Link Zone + Non-Refractory gold ore (“NRG1”); |
The June 2007 PFS reports were subject to Harmony Gate Reviews (“Gate Reviews”) and aCompetent Persons Report (“CPR”). Neither the Gate Reviews nor the CPR identified any fatal flawsin the PFS reports. However, a number of outstanding issues were identified and the December 2007PFS report are still subject to the Gate Review process. The returns projected by the June 2007studies did not meet the
22
requirements,and it was decided then not to immediately proceed to the feasibility stage. Further studies are plannedfor fiscal 2009 to address outstanding issues and to investigate alternative production scenarioswhich may improve projected returns. PNG represents approximately 6% (or 2.99 million ounces) ofour proven and probable reserves.
Strategy
During fiscal year 2008, we endeavoured to focus on three key aspects all of which we havedelivered on during the year under review.
| | • | | First, we undertook to review our operational performance and maintaina clear operational focus. This entailed developing an understandingof what our operations were capable of delivering, devising andputting in place the plans to ensure delivery, and holding managementresponsible for that delivery. |
| |
| | • | | Second, we assessed our assets, to focus our attention on thoseoperations that were core to the business and had the ability to beprofitable. At the same time, we identified and initiated jointventures we believed where these assets could better cater for themedium- and longer-term health of the company and bring about greatervalue. |
| |
| | • | | Finally, we undertook to improve the financial viability of thebusiness and to substantially overhaul the balance sheet. In so doing,we focused on improving operational performance, combined with thesale of non-core assets and partnering in joint ventures. We undertookto identify opportunities to sustain and grow production. While ourexploration work in PNG continues, we are also about to begin withsome organic exploration work at Evander in South Africa. This elementof our strategy is at an early stage and will be an area of increasedattention during the year ahead. |
We believe that the following strengths provide us with a competitive advantage:
Leading market position in the attractive gold industry
| | • | | We believe that our size and leading market position enables us toundertake exploration and simultaneously develop multiple projectsaround the world, as well as secure capital on competitive terms. |
| |
| | • | | The global gold industry offers a number of attractive industryfundamentals from which we benefit. This includes the absence ofavailable substitutes, relatively high barriers to entry, andincreasing gold producer concentration. |
| |
| | • | | We are developing new mines at a planned lower cost per ounce than ourcurrent operations, which we believe will help make them robust enoughto survive any margin squeeze and to withstand any reversal in thegold price. We expect the gold price to continue its upward trend inthe medium term |
Significant reserves with long mine lives
| | • | | Our ore reserves as of June 30, 2008 amounted to 50.5 million ouncesof gold spread across our assets in South Africa and PNG. This orereserve base is sufficient to support our existing production profilein excess of 10 years at current production levels. Year-on-yeardepletion accounted for a decrease of 1.9 million ounces in thereserves. Corporate activity, the exclusion of operations held forsale, restructuring of certain shafts and geological related changesaccounts for a further decrease of 5.7 million ounces of reserves. Onthe positive side there is a net addition of 4.4 million ounces ofreserves from surface stockpiles. |
| |
| | • | | Of our 50.5 million ounces of reserves, 38.3 million ounces areclassified as above infrastructure and 12.2 million ounces areclassified as below infrastructure (reserves for which capitalexpenditure has still to be approved). |
Highly attractive project pipeline
| | • | | We have a diverse portfolio of gold development projects spread across SouthAfrica and PNG. These projects include Elandsrand, Doornkop, Tshepong and Phakisain South Africa, and Hidden Valley in PNG, which, when developed, could deliver upto 1.4 million ounces of additional production by 2012. |
23
| | • | | We believe the relatively higher grade of these South African deposits and/orlower cost base will result in these ounces being produced at highly competitivecash costs. This in turn may result in a reduction in our overall cash costposition as these new projects are commissioned. |
| |
| | • | | In addition to these projects, we have a number of additional developmentprospects that are being considered and progressed, including the processing ofsand dumps and tailings dams in our Mega Dumps projects, the processing of rockdumps, and developing the Wafi/Golpu copper/gold deposit in PNG, which, when alldeveloped, could increase production by 1.0 million ounces per annum. |
| |
| | • | | We have also expanded our exploration skill base, evidenced by our progress in PNG. |
| |
| | • | | We formed Rand Uranium (Proprietary) Limited (“RandUranium”), to which we will transfer ourCooke assets to optimize the value of our uranium deposits. |
Positive gold market outlook
| | • | | In the midst of volatile tumultuous global investment markets, thegold market has demonstrated great resilience and a positive upside.The price performance throughout fiscal 2008 supports our positiveoutlook for gold and, given our operational imperatives, we will seekto contain costs, increase output and optimize our margins. |
| |
| | • | | The gold price hit a high of U.S.$1,030 per ounce on March 17, 2008and, while it was a more subdued U.S.$772 per ounce as ofOctober 21,2008, this is 3% higher than it was for the same time the previousyear. |
| |
| | • | | We believe the fundamental drivers behind increased demand anddecreased new supply of gold will remain in the future, which will inturn support a higher gold price over this period. As an unhedged goldproducer, we will benefit from a rising gold price environment. |
Increased focus on earnings margins and cost
| | • | | Our aim remains to return to profitability. At an operational level wehave put in place an intensive process of business planning, withbenchmarks and targets we believe to be realistic. |
| |
| | • | | We are committed to lower our cost base and extensively benchmark ourcosting parameters both internally among our operations, andexternally against other gold producers. Stringent cost cutting andcost control programs have been implemented. |
| |
| | • | | We are confident that the benefits of our restructuring process andongoing cost focus will be sustained in the long term, and as aresult, our ability to withstand any future adverse market conditionshas been significantly enhanced. |
Conservative balance sheet and low gearing
| | • | | We maintain a conservative gearing policy and seek to fund ongoingcapital expenditure (excluding growth projects) through cash generatedfrom existing operations. |
| |
| | • | | Our low level of gearing should provide us with the ability to utilizedebt to fund capital and development expenditure requirements for ournew projects. |
Experienced management team with significant industry expertise
| | • | | Our senior management team consists of experienced mining executiveswith extensive industry backgrounds combined with geological andmetallurgical expertise. |
| |
| | • | | Our senior management team has a proven track record in developing andmanaging the operations under its control, and has demonstrated anability to optimize underperforming assets as well as developing newprojects around the world. |
24
Leading Black Economic Empowerment strategy
| | • | | We are proud to be a South African company and fully embraces thecountry’s transformation initiatives. We are 16% owned by AfricanRainbow Minerals Limited (“ARM Limited”), a black empowerment company in whichour chairman, Patrice Motsepe, owns an interest. |
| |
| | • | | We believe that we have gone beyond the requirements of the MiningCharter by ensuring that our HDSA partners are truly empowered, thatwe are largely managed by a HDSA Board, and that we continue to engagewith black shareholders and/or partners to find more opportunities toinvest in BEE transactions and involve HDSA partners. |
| |
| | • | | We will continue to embrace empowerment as part of our growth strategyand we acknowledge that empowerment forms a fundamental part of ourbusiness into the future. |
Strategy of organic growth
Our organic growth strategy is focused on the extraction of high-quality ounces and developingand operating our long-life mines. Through our back to basics approach of disciplined mining, weaim to reduce costs and increase productivity. Our dedicated and participative management teamendeavours to meet production targets, reduce costs and optimize the orebodies for the benefit ofall our stakeholders.
Organic growth focused on high quality ounces
| | • | | Our extensive experience and established track record of successfully identifying,exploring and developing our own projects is a core component of our valuecreation strategy. |
| |
| | • | | Our ongoing exploration program is focused on both on-mine exploration, whichtargets resources within the economic radius of existing mines, and new mineexploration, which targets promising early to advanced stage projects around theworld. |
| |
| | • | | We are currently expanding our production base in South Africa and PNG, with afocus on developing new mines at competitive cash costs and upgrading the overallquality of our portfolio. |
| |
| | • | | We currently have a diverse project pipeline, comprising five projects that arewell advanced and, if all developed, could deliver up to 1.4 million ounces oflow-cost production by 2012. These projects include Elandsrand New Mine, DoornkopSouth Reef, Tshepong Sub 66 and Sub 71 Declines and Phakisa in South Africa, andHidden Valley in PNG, which, if all developed, would contribute to a reduction inour overall cash costs per ounce when they come on-stream. |
| |
| | • | | In addition to these projects, we have a number of additional developmentprospects that are being progressed, including surface sand dumps, rock dumps andtailings dams, reviewing the potential of our uranium deposits, and developing theWafi/Golpu copper/gold deposit in PNG, which, when an investment decision is takenby the board to develop them once feasibility studies are complete, could increaseproduction by up to 1.0 million ounces. |
| |
| | • | | We have also expanded our exploration skill base, evidenced by our progress in PNG. |
Operational Strategy: “Back to Basics”:
Our operational strategy is underpinned by the “back to basics” strategy of disciplinedmining, cost control, ore reserve management and efficiency.
Safety
We have dedicated a significant amount of attention to our safety initiatives during the year,and have seen improvements. These initiatives have been a key part of our restructuring andrefocusing initiative, and also part of the broader transformation of the workplace.
The commitment to zero fatalities starts at the top of the company and has filtered to everylevel through a conscious and programmatic
25
effort. The second round of a comprehensive safetyauditing program was completed in June 2008 including physical workplace audits, fall of ground regulations audits,shaft audits and metallurgical audits. Key non-negotiable principles that have been agreed uponinclude:
| | • | | management to lead by example; |
| |
| | • | | continuous verbal communication with all team members; |
| |
| | • | | visible creation of awareness of safety-related issues; |
| |
| | • | | award and recognize safety achievements; and |
| |
| | • | | the involvement of all stakeholders. |
While the workforce is motivated to become involved in taking responsibility for their ownsafety and that of their colleagues, a key management focus has been to improve undergroundconditions. In this respect, emphasis has been placed on those areas that are deemed to be of thehighest potential risk, namely, shaft infrastructure and physical conditions in the workplace.Again, in respect of the latter, the focus is on compliance with standards, the monitoring andmanagement of ground conditions and logistics to and from the workplace.
Empowered management teams
| | • | | At each mining site, we haveestablished small, multi-disciplinary, focused management teamsresponsible for planning and implementing the mining operations at thesite. Each of these teams is accountable for the results at itsparticular site and reports directly to the Board. |
Active involvement and management
| | • | | Annual operational goals and targets, including cost, volume and gradetargets are established in consultation with our executive committeefor each mining site. Each management team develops an operationalplan to implement the goals and targets for its mine site. Members ofour executive committee review and measure the results at each miningsite on a regular basis throughout the year. |
Focus on increased productivity
| | • | | Gold mining in South Africa is labor intensive, accounting for about50% of our South African operating costs. To control these costs, westructures our operations to achieve maximum productivity with thegoal of having 60% of our workforce directly engaged in stoping, orunderground excavation, and development rock breaking activities. |
Commitment to cost control
| | • | | We are committed to reducing our cost base and, to this end, webenchmark our costing parameters both internally among our operationsand externally against other gold producers. |
Proactive maintenance practices
| | • | | We apply a principle of “appropriate maintenance” which allows us tospend capital commensurate with the life of a specified operation.This principle ensures safe operation and reduces capital that may beused ineffectively on mines that have a limited life. |
Implementation of new systems
| | • | | We have implemented cost accounting systems and strict ore accountingand ore reserve management systems to measure and track costs and orereserve depletion accurately, so as to enable us to be proactive inour decision-making. |
Increasing consistency at our operations
| | • | | We are committed to increasing the consistency of our operations, interms of both gold ore grades and production levels, in order toextract optimal value from our orebodies. To achieve this, we arecontinuing with our intensive program to significantly improve themining flexibility of our operations by increasing our developmentexpenditure and focusing on comprehensive ore |
26
| | | | reserve management. We have made significant progress on this objective, as evidenced by ourdevelopment rates. |
| |
| | • | | We are currently reviewing potential opportunities in respect ofcertain deposits and assets which we may develop independently of ourcore gold business, and in particular, our uranium assets, of whichthe underground resources are not currently reflected on our balancesheet or reserve statement. |
Selected acquisitions that diversify our operations and complement our competitive strengths
| | • | | We have a long track-record of acquisitions, having completed over 25transactions and successfully integrating each of these operationsinto the Company. |
| |
| | • | | We possess broad and extensive gold mining experience gained throughthe development and operation of both surface, opencast mines andmechanized, underground mines. This breadth of expertise provides uswith a competitive advantage when evaluation acquisitionopportunities. |
Targeted disposals that will upgrade our overall portfolio quality
| | • | | We have accumulated a diverse portfolio of assets, a number of whichare nearing the end of their productive lives for us and areconsidered non-core to our business. However, these assets may be ofhigher value to smaller producers who are less concerned about shortmine lives, and can still profitably operate these assets for a numberof years. |
| |
| | • | | As a result, we believe our disposal strategy will create valuethrough the targeted sale of these assets, which for us haverelatively higher cost bases and/or shorter mine lives. See“Disposals” below. |
Initiatives that target specific opportunities
| | • | | We acknowledge significant capital expenditure and a commitment to along time horizon are required to develop our projects into new mines.However, we firmly believe that this is the foundation of our future,and to this end, have made substantial investments in our majorprojects both in South Africa and PNG. |
Principal Investments
We have concluded several other strategic transactions within and outside South Africa inthe last three fiscal years, which are summarized below.
On February 27, 2008, the Group acquired a 32.4% interest in Pamodzi Gold Limited (“Pamodzi”)after disposing of its Orkney assets. See Item 4. “Disposals”.
In March 2007, we concluded negotiations with Rio Tinto plc (“Rio Tinto”) in which wepurchased Rio Tinto’s rights to the royalty agreement entered into prior to our acquisition of theHidden Valley and Kerimenge deposits in PNG. The remaining condition precedent, which was to obtainapproval of the relevant PNG minister on the recommendation of the Mining Advisory Council that theroyalty rights may be transferred to us, was met in March 2008. Our cost of U.S.$22.5 million wasmet through the issue of shares and a cash payment of U.S.$2.5 million. The effect of thetransaction will be to reduce the cost of gold produced at Hidden Valley and all further extensionsto the project, mine life and reserves will be free of this royalty.
On December 8, 2006 we exchanged our Western Areas Limited (“Western Areas”) shares inexchange for Gold Fields Limited (“Gold Fields”) ordinary shares. See Item 4. “Disposals”. Wereceived 15.7 million Gold Fields shares, issued at R135.02 (U.S.$19.15) per share, for our 44.9million Western Areas shares. During the fiscal years 2008 and 2007, we disposed of our interestin Gold Fields. See Item 4. “Disposals”.
On June 21, 2006, we announced that we acquired 37.8% of the issued share capital of VillageMain Reef Gold Mining Company Limited (“Village”) for an amount of R458,775 (U.S.$0.1 million). Theequity stake was purchased from ARM Limited at a price of SA 20 cents per share. Due to the factthat the acquisition surpasses the 35% mark, we were obliged under the securities Regulation Codeon Takeovers and Mergers to extend an offer to the remaining shareholders of Village to acquire allof their shares at the same price at which it acquired the
27
37.8% stake. On August 14, 2006, weannounced that minority shareholders holding 3,163 shares in Village (being 0.08% of the shares in respect of which the offer was made) had accepted itsoffer. At June 30, 2008, we held 2,295,663 shares, representing 37.83% of the issued share capitalof Village. See Item 7. “Related Party Transactions”.
On March 9, 2006, we announced that we acquired a total of 44.9 million shares in WesternAreas for R2 billion (U.S.$321 million), representing a 29.2% stake. This was done by acquiring37.37 million shares from Allan Gray and buying a total of 7.62 million shares on the open market.To finance this acquisition, we entered into a term loan facility of R1.0 billion(U.S.$280.8 million) with Rand Merchant Bank (“RMB”), for the purpose of partially funding theacquisition of the 29.2% stake in Western Areas. See Item 7. “Related Party Transactions”.
Disposals
See Item 8. “Recent Developments” for post year-end disposals.
On February 27, 2008, we disposed of our Orkney operations to Pamodzi in exchange for 30million listed ordinary shares, the market value of which was R345 million (U.S.$46.5 million).
On November 30, 2007 the South Kalgoorlie operations were sold to Dioro in exchange for 11.6million listed ordinary shares, the market value of which was U.S.$17.5 million (A$20 million), aswell as a cash of U.S.$18.7 million (A$21 million). A loss of U.S.$8.76 million (A$9.8 million),net of tax, was realized.
On August 24, 2007, the Group disposed of the remaining 13,095,079 ordinary Gold Fieldsshares. The proceeds amounted to R1,310 million (U.S.$182.9 million), resulting in a loss of R459million (U.S.$63.2 million).
In April 2007, the surface assets and metallurgical plant at Deelkraal was sold to OgoerionConstruction CC for R98 million (U.S.$13.7 million). It was agreed that the purchase price be paidin installments over a 24-month period.
In a range of transactions between January 22, 2007 and February 12, 2007, we disposed of1,150,000 Gold Fields shares for U.S.$19.7 million. The total cost of these shares wasU.S.$21.4 million, resulting in a loss of U.S.$1.7 million. During May and June 2007, a further1.5 million shares with a cost of U.S.$28.3 million were disposed of for U.S.$25.1 million,resulting in a loss of U.S.$3.2 million.
On December 8, 2006, we disposed of our interest in Western Areas in exchange for ordinaryshares in Gold Fields. This was in terms of an offer by Gold Fields whereby every 100 WesternAreas Shares were exchanged for 35 Gold Fields shares.
On October 19, 2006, Randfontein 4 Shaft was sold to Simmer & Jack Limited for an amount ofR60 million (U.S.$8.5 million).
On March 31, 2006, we disposed of the entire share capital of Buffalo Creek Mines (Pty)Ltd for A$24 million (U.S.$17.2 million). According to the agreement the A$24 million(U.S.$17.2 million) was to be settled as follows: (i) A$4.3 million (U.S.$3.1 million) to be paidin cash; (ii) 1,907,892 shares in GBS Gold International, valued at A$5 million (U.S.$3.6 million);(iii) A$5 million (U.S.$3.6 million) to be paid in cash in September 2006; (iv) Shares in GBS GoldInternational, equal in value to A$4.4 million (U.S.$3.1 million), to be issued in September 2006;and (v) A$5.4 million (U.S.$3.8 million) to be paid in cash in September 2007. The net asset valueof Buffalo Creek Mines (Pty) Ltd was A$20.1 million (U.S.$14.2 million), resulting in a profit ofA$3.1 million (U.S.$3 million). Final settlement was received as per contract in September 2007.
On January 18, 2006, we disposed of our investment in Atlas Gold Limited forA$0.2 million (U.S.$0.15 million). The investment of 500,000 shares was carried at a total cost ofA$0.1 million (U.S.$0.07 million), resulting in a profit of A$0.1 million (U.S.$0.07 million).
On December 29, 2005, we disposed of our investment in San Gold Corporation for R19million (U.S.$3.1 million). The investment was carried at a total cost of R20 million (U.S.$3.2million), resulting in a loss of R1 million (U.S.$0.1 million).
On November 16, 2005, we disposed of the remaining portion of the Gold Fields investmentpurchased in fiscal 2005 for R2.4 billion (U.S.$361.8 million). The process was concluded throughmarket disposals which began on November 10, 2005 and an open market offering on November 15 and16, 2005. The investment was acquired at a cost of R2.1 billion (U.S.$316.4 million), resulting ina profit of R307 million (U.S.$45.4 million).
Hedging Policy
We have consistently maintained a policy of not entering into forward sales, commodity,derivatives or hedging arrangements to establish a
28
price in advance for the sale of our future goldproduction, although we may do so in the future. As a result of this policy, Board approval is required when hedgingarrangements are to be entered into.
Where any such gold hedging position is acquired, our policy is to eliminate any suchpositions existing within acquired companies as soon as this can be achieved through sound,commercially advantageous transactions. There may, however, be instances where certain hedgepositions in acquired companies need to be kept in place for contractual or other reasons. In linewith this policy, we have historically closed out hedging arrangements inherited through ouracquisitions. Our revenues are sensitive to the exchange rate of the Rand and other non-U.S.currencies to the U.S. dollar, as all the revenues are generated by gold sales denominated in U.S.dollars. We do not enter into forward sales, commodity, derivatives or other hedging arrangementsto establish a Rand to U.S. dollar exchange rate in advance for the sales of our future goldproduction, although we may do so in the future.
In May 2007, we closed out the remainder of our Australian hedge book, which we inheritedwith the acquisition of the Hill 50 mine. In these transactions, some 220,000 ounces were closedout at an average spot rate of A$809/ounce, for a total cost of A$72.8 million (U.S.$60.0 million).As a result, we are completely unhedged.
Description of Mining Business
Exploration
Exploration activities are focused on the extension of existing orebodies andidentification of new orebodies, both at existing sites and at undeveloped sites.
Our gold-focused exploration program has two components:
| | • | | on-mine exploration, which looks for resources within the economic radius of existing mines, and |
| |
| | • | | new mine exploration, which is the global search for early to advanced stage projects. |
Once a potential orebody has been discovered, exploration is extended and intensified inorder to enable clearer definition of the orebody and the potential portions to be mined.Geological techniques are constantly refined to improve the economic viability of prospecting andmining activities.
We conduct exploration activities on our own or with joint venture partners. As at June30, 2008, our prospecting interest in South Africa measured 28,039 hectares (69,286 acres), 220,600hectares (545,114 acres) in PNG and 97,491 hectares (240,906 acres) in Australia. We spentU.S.$28 million on exploration in fiscal 2008 and the bulk of exploration expenditure was allocatedto activities in PNG and South Africa. In fiscal 2009, we intend to carry out exploration in PNGand South Africa.
Mining
The mining process can be divided into two main phases: (i) accessing the orebody and(ii) mining the orebody. This basic process applies to both underground and surface operations.
| | • | | Accessing the orebody. |
| |
| | | | In our South African underground mines, access to the orebody is bymeans of shafts sunk from the surface to the lowest economically andpractically mineable level. Horizontal development at variousintervals of a shaft (known as levels) extends access to the horizonof the reef to be mined. On-reef development then provides specificmining access. Horizontal development at various intervals of thedecline extends access to the horizon of the ore to be mined. Thedeclines are advanced on a continuous basis to keep ahead of themining taking place on the levels above. In our open-pit mines, accessto the orebody is provided by overburden stripping, which removes thecovering layers of topsoil or rock, through a combination of drilling,blasting, loading and hauling, as required. |
| |
| | • | | Mining the orebody. |
| |
| | | | The process of ore removal starts with drilling and blasting theaccessible ore. The blasted faces are then cleaned, and the ore istransferred to the transport system. In open-pit mines, gold-bearingmaterial may require drilling and blasting, and is usually collectedby bulldozers or shovels to transfer it onto trucks, which transportit to the mill. |
In our South African underground mines, once ore has been broken, train systems collectore from the faces and transfer it to a series of ore passes that gravity feed the ore to hoistinglevels at the bottom of the shaft. The ore is then hoisted to the surface in dedicated conveyancesand
29
transportedeither by conveyor belts directly or via surface railway systems or roads to the treatment plants. In addition to ore, waste rock brokento access reef horizons must similarly be hoisted and then placed on waste rock dumps.
Processing
We currently have nine operational metallurgical plants and two metallurgical plants oncare and maintenance in South Africa. We also have a metallurgical plant at the Hidden Valleyproject in PNG. The principal gold extraction processes we use are carbon in leach, or CIL, andcarbon in pulp, or CIP.
The gold plant circuit consists of the following:
| | • | | Comminution. |
| |
| | | | Comminution is the process of breaking up the ore to expose andliberate the gold and make it available for treatment. Conventionally,this process occurs in multi-stage crushing and milling circuits,which include the use of jaw and gyratory crushers and rod and tubeand ball mills. Our more modern milling circuits include semi- orfully-autogenous milling where the ore itself is used as the grindingmedium. Typically, ore must be ground to a minimum size beforeproceeding to the next stage of treatment. |
| |
| | • | | Treatment. |
| |
| | | | In most of our metallurgical plants, gold is extracted into a leachsolution from the host ore by leaching in agitated tanks. Gold is thenextracted onto activated carbon from the solution using the CIL or CIPprocesses. |
Gold in solution, at one of our plants, is recovered using zinc precipitation. Recoveryof the gold from the loaded carbon takes place by elution and electro-winning. Cathode sludge ordore bars produced from electro- winning is now currently sent directly to Rand Refinery. Most ofthe South African plants no longer use smelting to produce rough gold bars (dore). Our SouthAfrican zinc precipitation plants continue to smelt precipitate to produce rough gold bars. Thesebars are then transported to the Rand Refinery which is responsible for refining the bars to aminimum of good delivery status.
In fiscal 2006, we operated the only independent gold refinery and fabrication plant inSouth Africa. In fiscal 2006, approximately 84% of our South African gold production was refined atour refinery and the remainder was refined at the Rand Refinery, which is owned by a consortium ofthe major gold producers in South Africa. Since July 2006, all of our gold produced in South Africahas been sent to the Rand Refinery, as a decision was made to close the Harmony Refinery foreconomic reasons. The Australian gold production for fiscal years 2006 to 2008 was refined inAustralia at an independent refiner, AGR Matthey.
The South African government has emphasized that the production of value-added fabricatedgold products, such as jewelry, is an important means for creating employment opportunities inSouth Africa and has made the promotion of these beneficiation activities a requirement of theMining Charter described in Item 4. “Information on the Company Regulation — Mineral Rights”. Wesupport jewelry ventures in South Africa.
Harmony’s Management Structure
We have a de-centralized management structure that is based on small, empoweredmanagement teams led by General Managers at each of our operations. In South Africa, the GeneralManagers report to Alwyn Pretorius and Tom Smith, the Chief Operations Officers, and areresponsible for business optimization, ore reserve optimization, and for developing a businessculture at the operations. They also focus on long-term viability and growth of the operations. TheGeneral Managers are supported by an Ore Reserve Manager, a Business Analyst and a Human ResourcesLeader in ensuring the growth and long-term sustainability of the operations, and additionalexpertise and skill is obtained from the Mining Managers, Engineers and Human Resource Managers whoalso report to the respective General Managers.
Capital Expenditures
Capital expenditures for continuing operations incurred for fiscal 2008 totalled U.S.$500million, compared with U.S.$320 million for fiscal 2007 and U.S.$205 million for fiscal 2006. Theincrease in capital expenditure in fiscal 2008 compared with 2007 was primarily related to thedevelopment of the PNG assets, which accounted for 66% of the project capital expended. Capital wasalso expended on the Doornkop South Reef Project, Tshepong Sub 66 and 71 Declines, Phakisa and theElandsrand New Mine. During fiscal 2007, the increased development in PNG accounted for 45% of theproject capital expended in the year. This was also the primary reason for the increase in capitalexpenditure in fiscal 2007 compared with fiscal 2006. Expenditure was also incurred at DoornkopSouth Reef Project, Phakisa, Tshepong Sub 66 Decline and Elandsrand New Mine.
30
The focus of our capital expenditures in recent years has been underground development andplant improvement and upgrades. Several of these projects will be completed during fiscal 2009. Theremainder of the projects will still require a great deal of capital expenditure over the next twoto three years until they are substantially completed. During fiscal 2008, various funding optionswere investigated. These included entering into a partnering deal for the PNG assets. Thetransaction was concluded after year end. See Item 4. “Recent Developments”.
Capital expenditure for discontinued operations, including the non-cash portion, incurred forfiscal 2008 totaled U.S.$42 million, compared with U.S.$61 million for fiscal 2007 and U.S.$60million for fiscal 2006.
We have budgeted approximately U.S.$379 million for capital expenditures in fiscal 2009.Details regarding the capital expenditures for each operation are found in the individual minesections under “Business — Harmony’s Mining Operations”. We currently expect that our plannedoperating capital expenditures will be financed from operations and new borrowings as needed.However, if we decide to expand major projects such as the Poplar Project and the Rolspruit Projectat Evander beyond our current plans, we may consider alternative financing sources. SeeItem 4.“Information on the Company — Business — Harmony’s Mining Operations — Evander Operations”.
Reserves
As at June 30, 2008, we have declared proven and probable reserves of 50.5 millionounces, broken down as follows: 47.5 million ounces in South Africa and 3.0 million ounces in PNG.Of our 50.5 million ounces of ore reserves, 12.2 million ounces are classified as belowinfrastructure (that is, reserves for which capital expenditure has yet to be approved). There hasbeen a 3.2 million ounces year-on-year negative variance in ore reserves due to the followingreasons:
| | • | | normal depletion of 1.9 million ounces; |
| |
| | • | | corporate activity, the exclusion of operations held for sale, restructuringof certain shafts and geological-related changes resulting in a decrease of5.7 million ounces; and |
| |
| | • | | a net addition of 4.4 million ounces of ore reserves from surface stockpiles. |
We use the South African Code for the Reporting of Exploration Results, Mineral Resourcesand Ore Reserves (“SAMREC Code”), which sets out the internationally recognized procedures andstandards for reporting of mineral resources and ore reserves. We use the term “ore reserves’’herein, which has the same meaning as “mineral reserves”, as defined in the SAMREC code. Ourreporting of its PNG Ore Reserves complies with the Australian Code for the Reporting of MineralResources and Ore Reserves (“JORC”) of the Australian Institute of Mining and Metallurgy. Thiscode is materially the same as “SAMREC”. In reporting of reserves, we have complied with IndustryGuide 7 of the U.S. Securities and Exchange Commission.
For the reporting of Ore Reserves at our South African and PNG operations, we use a goldprice of U.S.$750 per ounce. An exchange rate of R7.46 per U.S. dollar is used for South Africa andfor PNG an exchange rate of U.S.$0.80 per Australian dollar is used giving a gold price of R180,000per kilogram and AU$850 per ounce, respectively. These gold prices have also been used in mineplanning.
In order to define that portion of a measured and indicated mineral resource that can beconverted to a proven and probable ore reserve at our underground operations, we apply the conceptof a cut-off grade. This is done by defining the optimal cut-off as the lowest grade at which anorebody can be mined such that the total profits, under a specified set of mining parameters, aremaximized. The cut-off grade is determined using our Optimizer computer program which requires thefollowing as input:
| | • | | the database of measured and indicated resource blocks (per shaft section); |
| |
| | • | | an assumed gold price which, for this ore reserve statement, was taken as R180,000 per kilogram; |
| |
| | • | | planned production rates; |
| |
| | • | | the mine recovery factor (MRF) which is equivalent to the mine call factor (“MCF”) multipliedby the plant recovery factor; and |
| |
| | • | | planned cash costs (cost per tonne). |
31
Rand per tonne cash costs of the mines are historically based, but take into accountdistinct changes in the cost environment, such as the future production profile, restructuring,right-sizing, and other cost reduction initiatives which we expect in the aggregate to lead tolower unit costs, and for below-infrastructure ounces, an estimate of capital expenditure.
The block cave reserve at Golpu (PNG) used the PCBC computer program to define the optimalmine plan and sequencing.
The open pit reserve at Hidden Valley (PNG) is constrained by the capacity of the tailingsstorage facility with Whittle optimisation program guiding the most efficient mine design giventhis constraint.
The ore reserves represent that portion of the measured and indicated resources abovecut-off in the life-of-mine plan and have been estimated after consideration of the factorsaffecting extraction, including mining, metallurgical, economic, marketing, legal, environmental,social, and governmental factors. A range of disciplines which includes geology, survey, planning,mining engineering, rock engineering, metallurgy, financial management, human resources management,and environmental management have been involved at each mine in the life-of-mine planning processand the conversion of resources into reserves. The ore flow-related modifying factors used toconvert the mineral resources to ore reserves through the life-of-mine planning process are statedfor each individual shaft. For these factors, historical information is used, except if there is avalid reason to do otherwise. Because of depth and rock engineering requirements, some shaftsdesign stope support pillars into their mining layouts which accounts for approximately 7% to 10%discounting. Further discounting relates to the life-of-mine extraction to provide for unpay andgeological losses.
Our standard for narrow reef sampling with respect to both proven and probable reservecalculations for underground mining operations in South Africa is applied on a 6 meter by 6 metergrid. Average sample spacing on development ends is at 2 meter intervals in development areas. Forthe massive mining at the Target operations, our standard for sampling with respect to both provenand probable reserves are fan drilling with “B” sized diamond drill holes (43mm core) sited at 50meter spaced sections along twin access drives. The Kalgold open cast operations are sampled ondiamond drill and reverse circulation drill spacing of no more than 25 meters on average. Surfacemining at South African operations other than Kalgold involves recovering gold from areaspreviously involved in mining and processing, such as metallurgical plants, waste rock dumps andtailing dams (slimes and sand) for which random sampling is used.
The PNG resources are hosted in large porphyry or related mesothermal geological systems. Datais gained through diamond drilling using PQ down to NQ sized core. The core is cut in half, onehalf sampled at a maximum of 2 meter intervals and the other half stored in designated core storagefacilities. Drill spacing is typically on less than 20 meter centres for Measured category, 20 to40 meter centres for the Indicated category and greater than 40m for Inferred category material.Assaying for gold is by fire assay and various methods are used for copper and other elements. Allassays informing the resource calculation are analysed at a NATA accredited commercial laboratory.Some sample preparation is done at the mine site laboratory. Extensive QA/QC work is undertaken anddata is stored in electronic database.
32
Our mining operations’ reported total proven and probable reserves as of June 30, 2008 are set outbelow:
Ore reserve statement (Imperial) as at June 30, 2008(2)
Gold
| | | | | | | | | | | | | | | | | | | | | | | | | | | | | | | | | | | | | |
| | | PROVEN | | PROBABLE | | TOTAL |
| | | Tons | | Grade | | Gold(1) | | Tons | | Grade | | Gold(1) | | Tons | | Grade | | Gold(1) |
| Operations | | (million) | | (oz/ton) | | (Moz) | | (million | | (oz/ton) | | (Moz) | | (millions) | | (oz/ton) | | (Moz) |
| | | | | | | | | | | | | | | | | | | | | | | | | | | | | | | | | | | | |
South Africa Underground | | | | | | | | | | | | | | | | | | | | | | | | | | | | | | | | | | | | |
Tshepong | | | 6.64 | | | | 0.177 | | | | 1.18 | | | | 19.32 | | | | 0.176 | | | | 3.39 | | | | 25.96 | | | | 0.176 | | | | 4.57 | |
Phakisa | | | 0.09 | | | | 0.217 | | | | 0.02 | | | | 21.87 | | | | 0.243 | | | | 5.30 | | | | 21.96 | | | | 0.242 | | | | 5.32 | |
Bambanani | | | 3.15 | | | | 0.283 | | | | 0.89 | | | | 1.09 | | | | 0.268 | | | | 0.29 | | | | 4.24 | | | | 0.279 | | | | 1.18 | |
Doornkop | | | 0.37 | | | | 0.118 | | | | 0.04 | | | | 1.11 | | | | 0.124 | | | | 0.14 | | | | 1.48 | | | | 0.123 | | | | 0.18 | |
Elandskraal | | | 4.83 | | | | 0.186 | | | | 0.90 | | | | 39.56 | | | | 0.195 | | | | 7.73 | | | | 44.39 | | | | 0.194 | | | | 8.63 | |
Masimong | | | 4.01 | | | | 0.147 | | | | 0.59 | | | | 1.09 | | | | 0.155 | | | | 0.17 | | | | 5.1 | | | | 0.148 | | | | 0.76 | |
Virginia operations | | | 5.92 | | | | 0.127 | | | | 0.75 | | | | 2.63 | | | | 0.144 | | | | 0.38 | | | | 8.55 | | | | 0.132 | | | | 1.13 | |
| |
Evander | | | 3.08 | | | | 0.202 | | | | 0.62 | | | | 8.12 | | | | 0.163 | | | | 1.32 | | | | 11.20 | | | | 0.173 | | | | 1.94 | |
Evander(below infrastructure) | | | — | | | | — | | | | — | | | | 57.24 | | | | 0.213 | | | | 12.21 | | | | 57.24 | | | | 0.213 | | | | 12.21 | |
Target | | | 9.22 | | | | 0.214 | | | | 1.97 | | | | 12.72 | | | | 0.179 | | | | 2.28 | | | | 21.94 | | | | 0.194 | | | | 4.25 | |
Other — underground | | | 0.90 | | | | 0.144 | | | | 0.13 | | | | 2.14 | | | | 0.149 | | | | 0.32 | | | | 3.04 | | | | 0.145 | | | | 0.45 | |
Total S.A. Underground | | | 38.21 | | | | 0.185 | | | | 7.09 | | | | 166.89 | | | | 0.201 | | | | 33.53 | | | | 205.10 | | | | 0.198 | | | | 40.62 | |
| | | | | | | | | | | | | | | | | | | | | | | | | | | | | | | | | | | | |
South Africa surface | | | | | | | | | | | | | | | | | | | | | | | | | | | | | | | | | | | | |
Kalgold | | | 12.46 | | | | 0.026 | | | | 0.33 | | | | 1.79 | | | | 0.037 | | | | 0.07 | | | | 14.25 | | | | 0.028 | | | | 0.39 | |
Free Gold | | | 803.16 | | | | 0.007 | | | | 5.68 | | | | 77.39 | | | | 0.010 | | | | 0.80 | | | | 880.55 | | | | 0.007 | | | | 6.47 | |
Total S.A. Surface | | | 815.62 | | | | 0.007 | | | | 6.01 | | | | 79.18 | | | | 0.011 | | | | 0.87 | | | | 894.80 | | | | 0.008 | | | | 6.88 | |
| | | | | | | | | | | | | | | | | | | | | | | | | | | | | | | | | | | | |
PNG | | | | | | | | | | | | | | | | | | | | | | | | | | | | | | | | | | | | |
Hidden Valley and Kaveroi | | | 3.64 | | | | 0.067 | | | | 0.24 | | | | 24.46 | | | | 0.059 | | | | 1.46 | | | | 28.10 | | | | 0.060 | | | | 1.70 | |
Hamata | | | — | | | | — | | | | — | | | | 4.33 | | | | 0.074 | | | | 0.32 | | | | 4.33 | | | | 0.074 | | | | 0.32 | |
Golpu | | | — | | | | — | | | | — | | | | 54.63 | | | | 0.018 | | | | 0.97 | | | | 54.63 | | | | 0.018 | | | | 0.97 | |
Total PNG | | | 3.64 | | | | 0.067 | | | | 0.24 | | | | 83.42 | | | | 0.033 | | | | 2.75 | | | | 87.06 | | | | 0.034 | | | | 2.99 | |
| | | | | | | | | | | | | | | | | | | | | | | | | | | | | | | | | | | | |
Grand total | | | 857.47 | | | | 0.016 | | | | 13.34 | | | | 329.49 | | | | 0.113 | | | | 37.15 | | | | 1,186.96 | | | | 0.043 | | | | 50.49 | |
| | |
| (1) | | Gold oz figures are fully inclusive of all mining dilutions and gold losses, and are reported as mill-delivered tons and head grades. Metallurgical recovery factors have not been applied to the reserve figures stated above. The approximate metallurgical recovery factors for the table above are as follows: Elandskraal 96%; Free State 95%; Randfontein 95%; Evander 97%; Kalgold 90%; Freegold 96%; Target 97%; PNG 93%. In order to derive the appropriate plant recovery factors for ore reserve estimates aprocess have been followed where realistic assumptions based on historical performance have been applied. There may be short term fluctuation either positive or negative which can lead to small discrepancies between actual and planned recovery factors. |
| |
| (2) | | Cut-off grades are calculated per individual shaft, each having its own unique cost structure, ore flow and recovery factors, which are entered into our “Optimizer” software for a cut-off calculation per shaft and expressed in oz/t units. |
33
In addition to the gold reserves, we also report our equity reserves for silver, copper andmolybdenum from our PNG operations. Metal prices are assumed at U.S.$12/oz for silver,U.S.$2.40/lb for copper and U.S.$20/lb for molybdenum.
| | | | | | | | | | | | | | | | | | | | | | | | | | | | | | | | | | | | | |
| SILVER | | |
| | | | | | | Proven | | | | | | | | | | Probable | | | | | | | | | | Total | | |
| | | | | | | Reserves | | | | | | | | | | Reserves | | | | | | | | | | Reserves | | |
| | | Tons | | Grade | | Silver oz | | Tons | | Grade | | Silver oz | | Tons | | Grade | | Silver oz |
| PNG | | (millions) | | (oz/ton) | | (millions) | | (millions) | | (oz/ton) | | (millions) | | (millions) | | (oz/ton) | | (millions) |
Hidden Valley andKaveroi | | | 3.64 | | | | 1.197 | | | | 4.36 | | | | 24.46 | | | | 1.077 | | | | 26.35 | | | | 28.10 | | | | 1.093 | | | | 30.71 | |
GRAND TOTAL | | | 3.64 | | | | 1.197 | | | | 4.36 | | | | 24.46 | | | | 1.077 | | | | 26.35 | | | | 28.10 | | | | 1.093 | | | | 30.71 | |
| | | | | | | | | | | | | | | | | | | | | | | | | | | | | | | | | | | | | |
| COPPER | | |
| | | | | | | Proven | | | | | | | | | | Probable | | | | | | | | | | Total | | |
| | | | | | | Reserves | | | | | | | | | | Reserves | | | | | | | | | | Reserves | | |
| | | Tons | | Grade | | Cu lbs | | Tons | | Grade | | Cu lbs | | Tons | | Grade | | Cu lbs |
| PNG | | (millions) | | (%) | | (millions) | | (millions) | | (%) | | (millions) | | (millions) | | (%) | | (millions) |
Golpu | | | — | | | | — | | | | — | | | | 54.63 | | | | 1.025 | | | | 1,234.0 | | | | 54.63 | | | | 1.025 | | | | 1,234.0 | |
GRAND TOTAL | | | — | | | | — | | | | — | | | | 54.63 | | | | 1.025 | | | | 1,234.0 | | | | 54.63 | | | | 1.025 | | | | 1,234.0 | |
| | | | | | | | | | | | | | | | | | | | | | | | | | | | | | | | | | | | | |
| MOLYBDENUM | | |
| | | | | | | Proven | | | | | | | | | | Probable | | | | | | | | | | Total | | |
| | | | | | | Reserves | | | | | | | | | | Reserves | | | | | | | | | | Reserves | | |
| | | Tons | | Grade | | Mo lbs | | Tons | | Grade | | Mo lbs | | Tons | | Grade | | Mo lbs |
| PNG | | (millions) | | (lbs/ton) | | (millions) | | (millions) | | (lbs/ton) | | (millions) | | (millions) | | (lbs/ton) | | (millions) |
Golpu | | | — | | | | — | | | | — | | | | 54.63 | | | | 0.238 | | | | 13.00 | | | | 54.63 | | | | 0.238 | | | | 13.00 | |
GRAND TOTAL | | | — | | | | — | | | | — | | | | 54.63 | | | | 0.238 | | | | 13.00 | | | | 54.63 | | | | 0.238 | | | | 13.00 | |
Our methodology for determining our reserves is subject to change and is based uponestimates and assumptions made by management regarding a number of factors as noted above in thissection.
Worldwide Operations
Description of Property
The following is a map of our worldwide operations:
Our operational mining areas in South Africa are set forth below:
| | | | | | | | | |
| | | Hectares | | Acres |
Doornkop | | | 2,941 | | | | 7,267 | |
Elandsrand | | | 5,113 | | | | 12,634 | |
Free State (includes Masimong and Virginia operations) | | | 22,583 | | | | 55,802 | |
Tshepong and Phakisa | | | 10,799 | | | | 26,683 | |
Bambanani | | | 2,356 | | | | 5,821 | |
Joel | | | 2,162 | | | | 5,342 | |
St Helena | | | 5,856 | | | | 14,471 | |
Kalgold | | | 615 | | | | 1,520 | |
| | | | | | | | |
Evander | | | 36,898 | | | | 91,174 | |
Target (includes Loraine) | | | 7,952 | | | | 19,649 | |
Total | | | 97,275 | | | | 240,363 | |
34
Our discontinued operational mining areas are set forth below:
| | | | | | | | | |
| | | Hectares | | Acres |
Mt. Magnet | | | 97,491 | | | | 240,906 | |
| |
Cooke (Randfontein) | | | 7,875 | | | | 19,460 | |
| | | | | | | | |
Lindum (Randfontein) | | | 3,231 | | | | 7,983 | |
Total | | | 108,597 | | | | 268,349 | |
In PNG, we hold granted tenements as set forth below:
| | | | | | | | | |
| | | Hectares | | Acres |
PNG | | | 220,600 | | | | 545,114 | |
Total Worldwide Operations | | | 426,472 | | | | 1,053,826 | |
In line with the rest of the South African mining industry, and in an effort to reduce costs,we have been rationalizing our mineral rights holdings in recent years. Accordingly, over the pastthree years, we have disposed of our shares and participation rights in areas within and outside ofSouth Africa in which we have not actively pursued mining. However, in some cases we have retainedcertain participation rights and option clauses in disposed of properties and mining rights. We maycontinue to investigate further disposals.
Geology
The major portion of our South African gold production is derived from mines located inthe Witwatersrand Basin in South Africa. The Witwatersrand Basin is an elongated structure thatextends approximately 300 kilometers in a northeast-southwest direction and approximately 100kilometers in a northwest-southeast direction. It is an Archean sedimentary basin containing a sixkilometer thick stratigraphic sequence consisting mainly of quartzites and shales with minorvolcanic units. The majority of production is derived from auriferous placer reefs situated atdifferent stratigraphic positions and at varying depths below the surface in three of the sevendefined goldfields of the Witwatersrand Basin.
Our Hidden Valley project comprises low sulphidation carbonate-base metal-gold epithermaldeposits within the Morobe Goldfield, in the Morobe Province of PNG. In the Hidden Valley projectarea, a batholith of Morobe Granodiorite (locally a coarse grained monzogranite) is flanked by finemetasediments of the Owen Stanley Metamorphics. Both are cut by dykes of Pliocene porphyry rangingfrom hornblende-biotite to feldspar-quartz porphyries. A number of commonly argillic altered andgold anomalous breccias are known, including both hydrothermal and over printing structuralbreccias. The Hidden Valley deposit area is dominated by a series of post Miocene faultscontrolling the gold mineralization, including an early north trending set and the main northwestfaulting.
Our Wafi project comprises the sedimentary/volcaniclastic rocks of the Owen StanleyFormation that surround the Wafi Diatreme and host the gold mineralization. Gold mineralizationoccurs as extensive high-sulphidation epithermal alteration overprinting porphyry mineralizationand epithermal style vein-hosted and replacement gold mineralization with associated wall-rockalteration. The Golpu Copper-Gold project is located about one kilometer northeast of the Wafi goldorebody. It is a porphyry (diorite) copper-gold deposit. The host lithology is a diorite thatexhibits a typical zoned porphyry copper alteration halo and the mineralized body can be describedas a porphyry copper-gold “pipe”.
Harmony’s Mining Operations — Overview
Previously, we discussed our South African operations per legal entity, which by design weregeographically grouped. These were Free State (owned by Harmony Company), Freegold, Elandsrand(originally known as the Elandskraal operations), Randfontein, Evander, Avgold, ARMgold andKalgold. The shafts were then further divided into categories of “Quality”, “Leveraged”, “Growth”and “Surface”.
As discussed under Item 4. “South African Operations”, we have changed the way in which wemanage our operations. In line with this change, we have amended the manner in which we discuss ouroperations.
35
In South Africa, we conduct underground mining at 11 operations:
| | • | | Tshepong (formerly part of Freegold) |
| |
| | • | | Phakisa (formerly part of Freegold) |
| |
| | • | | Bambanani (formerly part of Freegold) |
| |
| | • | | Doornkop (formerly part of Randfontein) |
| |
| | • | | Cooke operations (consists of Cooke 1, 2 and 3 shafts, formerly part of Randfontein) |
| |
| | • | | Elandsrand |
| |
| | • | | Masimong (formerly part of the Free State region) |
| |
| | • | | Virginia operations (consists of Harmony 2, Merriespruit 1 & 3, Unisel and Brand 3& 5, all formerly part of the Free State region) |
| |
| | • | | Target (forms part of Avgold’s operations) |
| |
| | • | | Evander (consists of Evander 5, 7 and 8) |
| |
| | • | | Joel (formerly part of Freegold, now included under “Other — Underground”) |
We conduct surface mining at five sites (all included in “Other — Surface”):
| | • | | Free State (also known as Phoenix) |
| |
| | • | | Randfontein (Cooke plant has been classified as discontinuedoperations along with the Cooke operations) |
| |
| | • | | Freegold |
| |
| | • | | Kalgold |
| |
| | • | | Target |
Surface mining conducted at the South African operations other than Kalgold involvesrecovering gold from areas previously involved in mining and processing, such as metallurgicalplants, waste rock dumps and tailings dams (slimes and sand).
Internationally, our mining was previously conducted at the following two sites in Australia:
| | • | | Mt. Magnet — The site has put on care and maintenance as at the end ofDecember 2007. On August 1, 2008, the Monarch Gold’s administratorindicated that Monarch Gold would not proceed with the proposedpurchase, and consequently the agreement was terminated. We havesince resumed management of the of the Mt. Magnet operations andrecommenced the sales process — See “International Operations” above. |
| |
| | • | | South Kalgoorlie — we finalized the sale of this operation with Dioroon November 30, 2007 — See “Disposals” above. |
Underground and surface mining was conducted at each of these operations, with undergroundaccess through two declines at Mt. Magnet and one decline at South Kalgoorlie and surface accessprincipally through open-pits. Surface mining at South Kalgoorlie ceased in fiscal 2006 withtreatment consisting of Mt. Marion ore and low grade stockpiles. Open-pit mining recommenced atSouth Kalgoorlie mines during fiscal 2007. The Mt. Marion underground operation at South KalgoorlieMines ceased in June 2007, with only open-pit operations continuing on that site until the date ofsale to Dioro.
The following discussion is a two-part presentation of our operations:
| | • | | an overview of our South African mining operations with a discussionand production analysis of each of our operating segments; and |
| |
| | • | | an overview of our International (Australian and PNG) operations. |
Where we have translated the Rand amount budgeted for capital expenditures in 2009 into U.S.dollars, we have used the closing rate at the balance sheet date.
South African Mining Operations
Unless indicated otherwise, the discussions below are for continuing operations.
36
Underground
Tshepong, Phakisa and Bambanani
Introduction: We acquired Tshepong, Phakisa and Bambanani when we, in January 2002, acquired theFreegold operations from AngloGold through a 50 % joint venture with ARMgold. In September 2003, weacquired 100% of these operations when ARMgold became a wholly owned subsidiary. These operationsare located in the Free State province. Production from the operations is processed through twoprocessing facilities (the Free State 1 (“FS 1 Plant”) and Central plant, the latter forms part ofour Virginia operations).
History: Exploration, development and production history in the area of the Freegold assets datesfrom the early 1900’s, leading to commercial production by 1932. Subsequent consolidation andrestructuring led to the formation of Free State Consolidated Gold Mine (Operations) Limited, whichbecame a wholly-owned subsidiary of AngloGold in June 1998.
Geology: The operations are located in the Free State Goldfield, which is on the southwestern edgeof the Witwatersrand basin. The Bambanani, Tshepong and Phakisa mines are located to the north andwest of Welkom. Mining is primarily conducted in the Basal reef, with limited exploitation of the BReef at Tshepong. The reefs generally dip towards the east or northeast while most of the majorfaults strike north-south. B Reef is being mined at Tshepong with potential of being exploitedelsewhere.
Mining Operations: These operations are subject to the underground mining risks detailed in theRisk Factors section. The management teams regularly revisit their mining strategy and managementprocedures in order to minimize risks.
Mining is conducted at depths ranging from 1,911 and 3,129 meters at Bambanani and betweendepths of 1,671 and 2,245 meters at Tshepong. The primary mining challenges at these operationsare seismic risks, ventilation and fire avoidance. Bambanani is classified as a seismically activeoperation with seismic activity monitoring systems installed to do active seismic risk evaluation.Seismic activity monitoring systems are upgraded on a continuous basis to ensure that it is keptabreast of emerging technology. Current ventilation and refrigeration systems were evaluated andimproved with refrigeration plants installed at the Bambanani and Tshepong Mines. We believe thiswill improve productivity and safety after operations at Tshepong were hampered by a number offires and seismic events that significantly affected production in the first half of fiscal 2008.
The Tshepong Decline project, which started in April 2003, has accessed an additional twolevels (69 and 71) of the Tshepong North Shaft. The Sub 66 project neared completion at the end ofJune 2008 with a total capital expenditure of R289 million (U.S.$39.8 million). The balance of thefinal estimated capital of R291million (U.S.$40 million) will be spent during the first quarter offiscal 2009. Production commenced at Sub 66 Decline during the year, with the build-up to continueover the next two years. Emphasis is now being placed on significantly increasing mineablereserves. Poor ground conditions caused some delays to the project, with the final mining componentbeing completed in June 2008, and all project work scheduled for completion by December 2008. Goodprogress was made at the Sub 71Decline project during fiscal 2008, with a total of 1,089 metresbeing developed by year-end. The escalation of input costs, combined with skills shortages (designand engineering draughting personnel) had a negative impact on the project. First production isexpected in August 2012, with full production anticipated in July 2017. The total estimated valueof this project is R132 million (U.S.$18 million).
The development at Phakisa, a surface shaft, sunk to 75 level elevations and a planned declineshaft to 85 levels will access the ore reserves to a depth of 2,662 meters below surface. It isestimated that the area will yield 22.0 million tons, recovering 182.5 tons of gold over a projectlife of 22 years. Project completion requires sinking of a decline shaft, equipping andcommissioning of the shaft with access development and stoping to maximum production build-up at acapital cost of R1,348 million (U.S.$185.5 million). To date, R866 million (U.S.$119.2 million) hasalready been spent. Good progress was achieved during fiscal 2008, with the reef ore passes, reefhoisting facility and Rail-veyor reef and waste handling on 55 level completed. The second train onthe Rail-veyor is planned for October 2008. Installation of the permanent water handling systems(i.e., Settlers, Main Pump Station on 77 Level, Mud press and underground dams) has progressed andexpected completion is October 2008. The cooling systems of Phakisa Shaft will include a firstphase 10MW Ice Plant on surface. This will be a first in the gold
37
mining industry. Phakisa startedthe first production during September 2007 and will be opening up ore reserves for the next two years. The project is expected to be in full productionin June 2011 at 83,000 tons per month. The average production rate per annum over the peak periodof life of mine is 253,360 ounces.
Bambanani was restructured during the third quarter of fiscal 2008 due to the power shortagesin the country. This resulted in the tonnages being reduced by 50%. There was also a significantreduction in the labor complement, with 2,086 people leaving through transfers and voluntaryretrenchments. Bambanani now operates as a low tonnage high grade mine (8.0g/t recovered grade).
Conops was introduced at the operations during the quarter ended December 31, 2003. Conopswere stopped at Bambanani during April 2005. Conops was officially stopped at Tshepong duringJanuary 2008 after a due diligence study conducted during fiscal 2007 indicated that Conops was notdelivering at the planned levels. For a detailed discussion on Conops and the evaluation processthat was followed, see Item 5. “Operating and Financial Review and Prospects — Conops”.
During fiscal 2008, Tshepong accounted for 14% (14% in 2006 and 2007) of our total gold sales,with Phakisa accounting for 0.2% (nil in 2006 and 2007) and Bambanani 8% (8% in 2006 and 2007).
Safety: During fiscal 2008, the safety statistics for the operations compared to the Group averagefor lost time frequency rate (“LTFR”) of 12.83 per million hours worked and fatality frequency rate(“FFR”) of 0.18 are as follows:
| | | | | | | | | | | | | |
| |
| | | | | LTFR | | | FFR | |
| | Tshepong | | | 18.52 | | | | 0.17 | | |
| | Phakisa | | | 4.83 | | | | 0.37 | | |
| | Bambanani | | | 11.18 | | | | 0.40 | | |
| |
Safety standards receive constant and high-level attention at all the operations.
Plants: The ore from theses operations are sent to FS 1 Plant for processing. This plant, whichprocesses underground ore, waste rock and various surface accumulations, was commissioned in 1986and is a conventional CIP plant processing ore that has been milled by semi-autogenous grinding.Gold is recovered from the eluate solution using zinc precipitation and a precoat vacuum filter.The precipitate recovered from the filter is calcined and smelted to bullion.
The following table sets forth processing capacity and average tons milled during the fiscal2008 for the FS 1 Plant:
| | | | | | | | | |
| | | | | | | Average Milled for |
| | | Processing | | the Fiscal Year |
| Plant | | Capacity | | Ended June 30, 2008 |
| | | (tons/month) | | (tons/month) |
FS 1 | | | 420,000 | | | | 416,447 | |
In fiscal 2008, FS 1 Plant recovered approximately 97% of the gold contained in the oredelivered for processing.
Production analysis:
| | | | | | | | | | | | | |
| | | Fiscal Year Ended June 30, |
| Tshepong | | 2008 | | 2007 | | 2006 |
Production | | | | | | | | | | | | |
Tons (‘000) | | | 1,649 | | | | 1,824 | | | | 1,786 | |
Recovered grade (ounces/ton) | | | 0.166 | | | | 0.175 | | | | 0.188 | |
Gold sold (ounces) | | | 273,119 | | | | 318,887 | | | | 335,289 | |
38
| | | | | | | | | | | | | |
| | | Fiscal Year Ended June 30, |
| Tshepong | | 2008 | | 2007 | | 2006 |
Results of operations (millions) ($) | | | | | | | | | | | | |
Product sales | | | 223 | | | | 203 | | | | 180 | |
Cash cost | | | 125 | | | | 112 | | | | 111 | |
Cash profit | | | 98 | | | | 91 | | | | 69 | |
Cash costs | | | | | | | | | | | | |
Per ounce of gold ($) | | | 457 | | | | 351 | | | | 332 | |
Capex (millions) ($) | | | 27 | | | | 26 | | | | 21 | |
Tons milled from the Tshepong shaft increased to 1,824,000 in fiscal 2007, compared with1,786,000 in fiscal 2006. Ounces sold were 318,887 in fiscal 2007, compared with 335,289 in fiscal2006. This decrease was attributable to the decrease in recovery grade to 0.175 in fiscal 2007,compared with 0.188 in fiscal 2006. The decrease in recovery grade was primarily due to decreasesin the shaft call factor, plant call factor and the average mining grade which was 1365 cmg/t infiscal 2007, compared to 1440 cmg/t in fiscal 2006, in line with the Life of Mine (LOM) profile.Industry standard practice in South Africa is to report drill results and cut-off grades forresource estimates in gold as thickness-grade values (cmg/t).
Cash costs for the Tshepong shaft were U.S.$112 million in fiscal 2007, compared withU.S.$111 million in fiscal 2006. Cash costs per ounce were U.S.$351 in fiscal 2007, compared withU.S.$332 in fiscal 2006. This increase in unit cost was attributable primarily due to decrease inthe number of ounces of gold produced.
Tons milled declined by 10% from 1,824, 000 tons in fiscal 2007 to 1,649,000 in fiscal 2008,with gold production decreasing by 14% from 318,887 ounces in fiscal 2007 to 273,119 ounces infiscal 2008. The decrease was attributable to the decrease in the recovery grade to 0.166 infiscal 2008, compared with 0.175 in fiscal 2007. The decrease in recovery grade was primarily dueto the decrease in the shaft call factor and the average mining grade which was 1275 cmg/t infiscal 2008, compared to 1365 cmg/t in fiscal 2007. The drop in the average mining grade is in linewith the Life of Mine profile. During fiscal 2007 the mining in the east south block was in themain high grade pay shoot and as we continued mining south during fiscal 2008 we where miningcloser to the edge of this high grade channel. The continuation of this channel will be mined oncethe sub66 and sub 71 decline is completed. Tshepong was hampered by a number of fires and seismicevents that significantly affected production in the first half of fiscal 2008. The cessation ofConops also resulted in lower production.
Cash costs for the Tshepong shaft were U.S.$125 million in fiscal 2008, compared with U.S.$112million in fiscal 2007. Cash costs per ounce were U.S.$457 in fiscal 2008, compared with U.S.$351in fiscal 2007. This increase in unit cost is attributable primarily to decrease in the number ofounces of gold produced. Cash costs have increased by 11% in fiscal 2008, primarily due toincreases in the costs of labor and supplies and the effect of inflation on supply contracts.
On a simplistic basis, assuming no additional reserves are identified, at expected productionlevels, it is foreseen that the reported proven and probable ore reserves of 26.0 million tons (4.6million ounces) will be sufficient for Tshepong to maintain underground production untilapproximately 2024. Any future changes to the assumptions upon which the ore reserves are based, aswell as any unforeseen events affecting production levels, could have a material effect on theexpected period of future operations.
Capital Expenditure: We incurred approximately R195 million (U.S.$26.8 million) in capitalexpenditures at the Tshepong shaft in the fiscal 2008, primarily for the decline project andongoing development. We have budgeted R74.7 million (U.S.$10.3 million) for project capitalexpenditures in fiscal 2009. This capital includes R60.6 million (U.S.$8 million) for theadditional two levels 73 and 75 and B Reef exploration project of R10.8 million (U.S.$1.5million).
| | | | | | | | | | | | | |
| | | Fiscal Year Ended June 30, |
| Phakisa | | 2008 | | 2007 | | 2006 |
Production | | | | | | | | | | | | |
Tons (‘000) | | | 34 | | | | — | | | | — | |
Recovered grade (ounces/ton) | | | 0.123 | | | | — | | | | — | |
Gold sold (ounces) | | | 4,212 | | | | — | | | | — | |
39
| | | | | | | | | | | | | |
| | | Fiscal Year Ended June 30, |
| Phakisa | | 2008 | | 2007 | | 2006 |
Results of operations (millions) ($) | | | | | | | | | | | | |
Product sales | | | 4 | | | | — | | | | — | |
Cash cost | | | 2 | | | | — | | | | — | |
Cash profit | | | 2 | | | | — | | | | — | |
Cash costs | | | | | | | | | | | | |
Per ounce of gold ($) | | | 556 | | | | — | | | | — | |
Capex (millions) ($) | | | 40 | | | | 32 | | | | 23 | |
The expected capacity of the Phakisa shaft will be 131,175 tons per month. Phakisa has no rockhoisting facilities and all rock will be transported via a Rail system on 55 level to the Nyalashaft for hoisting to surface. First production took place during October 2007, with a build up tofull production expected in the next two to three years.
On a simplistic basis reported proven and probable underground ore reserves of 21.9 milliontons (5.3 million ounces) will be sufficient for the Phakisa shaft to, once production commence,maintain production until approximately fiscal 2030. Any future changes to the assumptions uponwhich the reserves are based, as well as any unforeseen events affecting production levels, couldhave a material effect on the expected period of future operations.
Capital Expenditure: We incurred approximately R293 million (U.S.$40 million) in capitalexpenditures at the Phakisa operations in the fiscal year ended June 30, 2008. We have budgetedRand 330 million (U.S.$45 million) for capital expenditures in fiscal 2009, primarily for theestablishing and development of the shaft.
| | | | | | | | | | | | | |
| | | Fiscal Year Ended June 30, |
| Bambanani | | 2008 | | 2007 | | 2006 |
Production | | | | | | | | | | | | |
Tons (‘000) | | | 912 | | | | 1,283 | | | | 1,402 | |
Recovered grade (ounces/ton) | | | 0.174 | | | | 0.154 | | | | 0.143 | |
Gold sold (ounces) | | | 158,985 | | | | 197,060 | | | | 200,739 | |
Results of operations (millions) ($) | | | | | | | | | | | | |
Product sales | | | 128 | | | | 126 | | | | 106 | |
Cash cost | | | 102 | | | | 115 | | | | 101 | |
Cash profit | | | 26 | | | | 11 | | | | 5 | |
Cash costs | | | | | | | | | | | | |
Per ounce of gold ($) | | | 641 | | | | 586 | | | | 502 | |
Capex (millions) ($) | | | 15 | | | | 17 | | | | 14 | |
Tons milled from the Bambanani shaft decreased to 1,283,000 in 2007 compared with 1,402,000 infiscal 2006. An underground fire in March 2007 resulted in production loss of 4,180 ounces infiscal 2007. Ounces sold were 197,060 in fiscal 2007, compared with 200,739 in fiscal 2006. Thedecrease in volumes was offset by an increase in the recovered grade, which increased from 0.143 infiscal 2006 to 0.154 in fiscal 2007.
Cash costs for Bambanani were U.S.$586 in fiscal 2007, compared with U.S.$502 in fiscal 2006.The costs per ounce increased by 17% in fiscal 2007, due primarily to increases in the costs oflabor and supplies and the effect of inflation on supply contracts.
Tons milled from the Bambanani shaft decreased to 912,000 in 2008 compared with 1,283,000 infiscal 2007. Ounces sold were 158,985 in fiscal 2008, compared with 197,060 in fiscal 2007. Thisdecrease was due to the restructuring of the shaft due to power constraints but was offset by abetter recovered grade, which increased from 0.154 in fiscal 2007 to 0.174 in fiscal 2008.
Cash costs for Bambanani were U.S.$641 in fiscal 2008, compared with U.S.$586 in fiscal 2007.The costs per ounce increased by 9% in fiscal 2008, due to the slow start up after the collapsingof the old ore pass system and increases in the costs of labor and supplies and the effect ofinflation on supply contracts
The rock hoisting capacity at Bambanani is 116,000 tons per month. The average tons milled infiscal 2008 was 76,000 tons per month due to the restructuring during the latter half of the fiscalyear. 46,000 tons per month are planned for fiscal 2009, offset by an increased recovered grade.
On a simplistic basis, assuming no additional reserves are identified, at expected productionlevels, it is foreseen that the reported proven
40
and probable ore reserves of 4.2 million tons (1.2million ounces) will be sufficient for Bambanani to maintain underground production until approximately 2020. Any futurechanges to the assumptions upon which the ore reserves are based, as well as any unforeseen eventsaffecting production levels, could have a material effect on the expected period of futureoperations.
Capital Expenditure: We incurred approximately R107 million (U.S.$14.7 million) in capitalexpenditures at Bambanani in the fiscal 2008, primarily for ongoing development. We have budgetedR25.3 million (U.S.$3.5 million) for capital expenditures in fiscal 2009 for access development forthe shaft pillar extraction and R26.3 million (U.S.$3.6 million) for ongoing development.
Doornkop
Introduction: Doornkop is located in the Gauteng Province of South Africa, approximately thirtykilometers west of Johannesburg. The operation is owned by Randfontein Estates Limited(“Randfontein”). Doornkop currently operates under its own mining authorization of 2,941 hectares.Production is treated at the Doornkop plant.
History: We acquired this operation when Randfontein became a wholly-owned subsidiary duringcalendar year 2008.
Geology: These operations are situated in the West Rand Goldfield of the Witwatersrand Basin, thestructure of which is dominated by the Witpoortjie and Panvlakte Horst blocks, which aresuperimposed over broad folding associated with the southeast plunging West Rand Syncline.
During the 2008 year the gathering of additional geological information from on-reefdevelopment and exploration drilling on the South Reef has increased our knowledge about thesedimentology and grade characteristics of this ore body. This new knowledge has been incorporatedinto a process whereby the geological depositional model has been extensively reviewed. This led toa change in the model from an original more channelized deposit to what we now see as being a moresheet-like deposit that was formed in a lower energy environment where the grade is distributedmore evenly across the ore body. This change resulted in an overall drop in the grade estimate ofthe South Reef. In practice, less selective mining would be taking place as a result and that wouldenable higher percentage extractions of the total ore body.
There are six identified main reef groupings in the area: the Black Reef; the VentersdorpContact Reef; the Elsburg Formations; the Kimberleys; the Livingstone Reefs; and the South Reef.Within these, several economic reef horizons have been mined at depths below surface between 600and 1,260 meters.
The reefs comprise fine to coarse grained pyritic mineralization within well developed thickquartz pebble conglomerates or narrow single pebble lags, which in certain instances are replacedby narrow carbon seams.
Mining Operations: These operations are subject to the underground mining risks detailed in theRisk Factors section. Due to the shallow to moderate depths of the operations, seismicity andpressure related problems are infrequent. There is a risk of subterranean water and/or gasintersections in some areas of the mines. However, this risk is mitigated by active and continuousmanagement and monitoring, which includes the drilling of boreholes in advance of faces. Wherewater and/or gas are indicated in the drilling, appropriate preventative action is taken.
Currently, the Kimberley Reef is mined on the upper levels of the Doornkop Shaft between 900and 1,100 meters below surface. Most of this mining is taking place on channel edges, which resultsin sporadic high, but mostly low recovered grades. Mining from conventional sections of this reefceased during fiscal 2008 while the trackless section will continue for two years during thebuild-up phase of production from the South Reef. During fiscal 2008, production was suspended for18 days due to equipping relating to the Doornkop South Reef project. These overlapped with theEskom power shortages to some degree, and both had an impact on the production.
The Doornkop South Reef Project was announced on January 22, 2003. The project involved thedeepening of the Doornkop main shaft to 1,973 meters to the South Reef, which lies between 1,650and 2,000 meters below surface, and includes development towards these mining areas. The estimatedfinal capital cost is R1.634 million (U.S.$224.8 million), with R956 million (U.S.$131.6 million)spent as of June 30, 2008.
The most significant achievement for fiscal 2008 was the completion of the sinking operationsand equipping of winding plant compartments. The rock winder on surface was commissioned duringMarch 2008. The Rock winder compartments in the shaft will be equipped by January 2009. Milestonesfor fiscal 2008 included the completion of station development and water and rock storagefacilities
41
which willfacilitate the first years of production build-up to full production. Remaining work includes development of twoadditional silos, development to reef on 192, 197 and 202 levels and pump station commissioning inOctober 2008. Full production is expected in July 2012.
During fiscal 2008, Doornkop accounted for 2% (2% in 2006 and 2007) of our total gold sales.
Safety: The safety record at these operations during fiscal 2008 was as follows: in terms of LTFRof 8.55 per million hours worked achieved at Doornkop compared favourably with the group average of12.83. The FFR (0.19) compared unfavorably with the group average of 0.18.
Safety at the operations receives constant and high-level attention and where problems areidentified, steps are taken to address the situation.
Plants: The processing facilities presently comprises of one operating plant, the Doornkopmetallurgical plant, which is serviced by a surface rail network. The Doornkop metallurgical plant,commissioned in 1985, is a conventional CIP plant, which was used to treat waste rock and othersurface accumulations. It is now treating all ore from underground mining at the Doornkop and Cookeoperations.
The following table sets forth processing capacity and average tons milled during fiscal 2008 forthe Doornkop plant:
| | | | | | | | | |
| | | | | | | Average Milled for the |
| | | Processing | | Fiscal Year Ended |
| Plant | | Capacity | | June 30, 2008 |
| | | (tons/month) | | (tons/month) |
Doornkop | | | 220,000 | | | | 144,537 | |
In fiscal 2008, the Doornkop plant recovered approximately 95% of the gold contained in theore delivered for processing. During fiscal 2006, the Doornkop plant was upgraded and allunderground tons were moved from Cooke to Doornkop plant.
Production analysis:
| | | | | | | | | | | | | |
| | | Fiscal Year Ended June 30, |
| Doornkop | | 2008 | | 2007 | | 2006 |
Production | | | | | | | | | | | | |
Tons (‘000) | | | 494 | | | | 597 | | | | 515 | |
Recovered grade (ounces/ton) | | | 0.089 | | | | 0.096 | | | | 0.085 | |
Gold sold (ounces) | | | 44,413 | | | | 57,364 | | | | 43,593 | |
Results of operations (millions) ($) | | | | | | | | | | | | |
Product sales | | | 35 | | | | 37 | | | | 23 | |
Cash cost | | | 31 | | | | 25 | | | | 24 | |
Cash profit | | | 4 | | | | 12 | | | | (1 | ) |
Cash costs | | | | | | | | | | | | |
Per ounce of gold ($) | | | 703 | | | | 439 | | | | 558 | |
Capex (millions) ($) | | | 48 | | | | 38 | | | | 26 | |
Tons milled from Doornkop shaft were 597,000 in fiscal 2007, compared with 515,000 in fiscal2006. Mining continues in the old, upper areas of the mine on the Kimberley reef, while the SouthReef project is developed. Volumes increased, mainly as a result of flexibility created during theyear by increasing development of the orebody. Ounces sold were 57,364 in fiscal 2007, comparedwith 43,593 in fiscal 2006. This increase in ounces sold was primarily due to the increase inrecovered grade and additional tons milled. The recovered grade improved to 0.096 in fiscal 2007,compared with 0.085 in fiscal 2006.
Cash costs per ounce of gold were U.S.$439 in fiscal 2007, compared with U.S.$558 in fiscal2006. This decrease was attributable primarily to the higher production volumes and the higherrecovered grade.
Tons milled from Doornkop shaft were 494,000 in fiscal 2008, compared with 597,000 in fiscal2007. Volumes were negatively affected mainly as a result of an 18 day planned production stoppageto facilitate required shaft work and a reduction in volume at the conventional Kimberley miningsection due to low grades. The shaft work was related to the South Reef project sinking program. Inaddition three days were lost to the industry through the Eskom power management process. Ouncessold were 44,143 in fiscal 2008, compared 57,364 in fiscal 2007.
42
The decrease in ounces sold wasprimarily due to the lower recovery grade and decrease in tons milled. The recovered grade deteriorated to 0.089 in fiscal 2008, compared with 0.096 infiscal 2007, due to the depletion of higher grade reserves in the Kimberley reef section of themine. The conventional mining sections of this reef mined in the channel edge areas and productionwas stopped during June 2008. Production from trackless areas will continue during the build-upphase of mining from the project South Reef areas
Cash costs per ounce of gold were U.S.$703 in fiscal 2008, compared with U.S.$439 in fiscal2007. This increase was attributable primarily to the lower production volumes and industry widecost increases. It was also adversely influenced by the movement out of Capital areas intoproduction areas which resulted in costs previously incurred as capital expenditure, now beingspent as operational costs.
The hoisting capacity of the Doornkop shaft is 185,000 tons per month. The average tons milledin fiscal 2008 were 41,166 tons per month.
On a simplistic basis, assuming no additional reserves are identified, at expected productionlevels, it is foreseen that the reported proven and probable ore reserves of 1.5 million tons (0.2million ounces) will be sufficient for the Doornkop shaft to maintain production untilapproximately fiscal 2019. Any future changes to the assumptions upon which the reserves are based,as well as any unforeseen events affecting production levels, could have a material effect on theexpected period of future operations.
Capital Expenditure: We incurred approximately R349 million (U.S.$48.0 million) in capitalexpenditures in fiscal 2008 at Doornkop, primarily for the shaft completion & equipping, supportinginfrastructure and development. We have budgeted R271.2 million (U.S.$37.3 million) for capitalexpenditures at the Doornkop South Reef project in fiscal 2009.
Elandsrand
Introduction: Elandsrand is located near Carletonville in the North West province of South Africa.The assets and associated liabilities were purchased during fiscal 2001 for approximatelyR1 billion (U.S.$128.4 million) from Anglogold. Production from the operation is treated at theElandskraal plant.
History: Gold mining began at Elandsrand in 1978 following approval of the project in 1974 byElandsrand Gold Mining Company. Two surface shafts and two adjoining sub-vertical shafts were sunkat Elandsrand. The sub-vertical shafts at Elandsrand, which accessed the deeper part of the VCRreef in the lease area, were completed in 1984. The deepening of the sub-vertical shafts toapproximately 3,600 meters below surface, has been completed. Activities are currently focused onaccessing and opening up areas of the new mine and on the development and construction of supportinfrastructure.
Geology: Elandsrand contains three identified main reef groupings, the Ventersdorp Contact Reef, orVCR, the Carbon Leader Reef, or CLR and the Mondeor Reef. Only the VCR is economic to mine and hasbeen mined at depths below surface between 1,600 and 2,800 meters with future production to takeplace up to 3,600 meters below surface at the Elandsrand operations. The VCR and CLR consist ofnarrow (20 centimeters to 2 meters) tabular orebodies of quartz pebble conglomerates hosting gold,with extreme lateral continuity.
At the Elandsrand operation, the vertical separation between the VCR and CLR increases east towest from 900 meters to 1,300 meters as a result of the relative angle of the VCR unconformitysurface to the regional stratigraphic strike and dip. The CLR strikes west-southwest and dips tothe south at 25 degrees. The VCR strikes east-northeast and has a regional dip of 21 degrees to thesouth-southeast. Local variations in dip are largely due to the terrace-and-slope palaeotopographysurface developed during VCR deposition.
Mining Operations: The Elandsrand mine is subject to the underground mining risks detailed inthe Risk Factors section.
The Elandsrand mine, a mature mine with a declining production profile, has the challenge of anew mine being developed underneath the old mine. The implementation of Conops between August 2004and February 2005 improved production. However, after an assessment done during fiscal 2008, Conopswas stopped during February 2008. The operation is still hampered by the lack of flexibility, anissue that will be addressed by the full commissioning of the new mine. Due to the operating depthsof the Elandsrand underground operations, seismicity and high rock stress are significant risks atthe mine. We regularly review our mining strategy and management procedures at all of miningoperations in our efforts to mitigate these risks. The primary challenges facing the Elandsrandoperations are the lowering of working costs, increasing mining flexibility, controlling capitalexpenditure and the timely completion of the Elandsrand New Mine by fiscal 2010.
Capital development on three levels of the New Mine has been completed and these levels areproducing 54% of the total ounces from the Mine. Ongoing development is taking place in botheasterly and westerly directions on these levels. Access development delays on two other levelsresulted from slow progress of the access haulages through the Cobra Dyke.
43
During 2008, further progress was made with the project, notably:
| | • | | 22 kv system to 100 level was completed and commissioned. |
| |
| | • | | The turbine dam between 92 and 95 level was completed during the year. |
| |
| | • | | The development of the refrigeration chambers on 98 and 100 level was completed. |
| |
| | • | | The centre hole of the No.3 Backfill shaft was drilled during the year and the preparation forthe sinking of the sub-bank was started in June 2008. |
| |
| | • | | The end of capital position was reached on 113 level RAW East. |
| |
| | • | | The centralized blasting system was installed and commissioned on 102, 105, 109 and 113 levels. |
| |
| | • | | All piping associated with the pumping on 115 level was installed during the year includingall electrical panels associated with the pumping. |
| |
| | • | | The chilled water feed and return shaft columns were installed in No.2 Backfill shaft from 95to 105 level. |
The project is expected to be completed by fiscal 2010 and is expected to have a life of mineof 20 years. From the inception of the project through the end of fiscal 2008, R776 million(U.S.$106.8 million) has been expended. A further R228 million (U.S.$31.4 million) has beenbudgeted to complete the project.
In October 2, 2007, an incident occurred at the Elandsrand operation involving a compressedpipe column which broke off below the shaft surface bank and fell to the bottom of the men — and -material shaft, causing extensive damage to the shaft steel work and electrical cables. Theincident resulted in 3,000 workers being stranded underground for more than 30 hours. Miningoperations were temporarily suspended for 42 days to allow for repairs to be conducted in theshaft. On November 16, 2007, we announced that a tripartite team, consisting of management, unionsand the Department of Minerals and Energy had found the shaft to be in good working condition.Elandsrand mine was brought back into operation on November 19, 2007 after it followedprecautionary safety procedures during the start up of underground workings. Management presentedits findings of the investigation to the DME relating to the pipe failure, emergency power, waterand evacuation services and procedures, as well as the impact of Conops on maintenance. While theemergency services were found to be acceptable, we have revised our emergency procedures and are inthe process of completing a new Code of Practice relating to emergency preparedness. Conditions inthe working places, following a 42 day period during which no production took place, were found tobe better than expected. Production at Elandsrand has resumed, and the shaft was back in fullproduction in December 2007.
In fiscal 2008, our Elandsrand operations accounted for approximately 8% (8% in fiscal years2007 and 2006) of our total gold sales.
Safety: During fiscal 2008, the safety record at the Elandsrand mine in terms of lost timefrequency rate 18.49 per million hours worked compared unfavourably with the group average of12.83. Significant work was done to address the seismic risk described above and the fatalityfrequency rate (0.08) returned to a more consistent ratio with the group average of 0.18 forunderground operations. Safety standards from our other operations are being applied at Elandsrandand receive constant and high-level attention.
Plants: Commissioned in 1978, the Elandsrand Plant has milling in closed circuit with primary andsecondary hydrocyclones, secondary ball milling in closed circuit with hydrocyclones, thickeningand cyanide leaching in a CIP pump cell carousel circuit. The CIP was commissioned after an upgradeof the facility in 1999. Loaded carbon from the Elandsrand Plant is transported by road to theCentral Plant at Virginia for elution, electro-winning and smelting to produce gold. Residues fromthe CIP are pumped either to a backfill plant or directly to the tailings facility. Ore fromElandsrand underground operations are delivered to the plant for treatment via conveyor belt afterbeing hoisted from underground. Due to a high percentage of freegold, a gravity concentrationcircuit is used to extract a large percentage of the gold. The sludge from this concentrator isthen transported by air to the Target Plant for extraction and smelting.
The following table sets forth processing capacity and average tons milled during fiscal 2008for the plant:
| | | | | | | | | |
| | | | | | | Average Milled for the |
| | | Processing | | Fiscal Year |
| Plant | | Capacity | | June 30, 2008 |
| | | (tons/month) | | (tons/month) |
Elandsrand Plant | | | 185,000 | (1) | | | 81,713 | |
44
| | |
| (1) | | Processing capacity will reach its optimal capacity upon completion of the Elandsrand New Mine Project. |
In fiscal 2008, the Elandsrand Plant recovered approximately 96.31% of the gold contained inthe ore delivered for processing.
Production analysis:
| | | | | | | | | | | | | |
| | | Fiscal Year Ended June 30, |
| Elandsrand | | 2008 | | 2007 | | 2006 |
Production | | | | | | | | | | | | |
Tons (‘000) | | | 981 | | | | 1,117 | | | | 987 | |
Recovered grade (ounces/ton) | | | 0.162 | | | | 0.174 | | | | 0.173 | |
Gold sold (ounces) | | | 158,631 | | | | 194,710 | | | | 170,867 | |
Results of operations (millions) ($) | | | | | | | | | | | | |
Product sales | | | 133 | | | | 124 | | | | 90 | |
Cash cost | | | 103 | | | | 103 | | | | 89 | |
Cash profit | | | 30 | | | | 21 | | | | 1 | |
Cash costs | | | | | | | | | | | | |
Per ounce of gold ($) | | | 652 | | | | 527 | | | | 523 | |
Capex (millions) ($) | | | 44 | | | | 33 | | | | 31 | |
Tons milled from the Elandsrand shaft were 1,117,000 in fiscal 2007, compared with 987,000 infiscal 2006. Ounces sold increased to 194,710 in fiscal 2007, compared with 170,867 in fiscal 2006as a result of the increased volumes in production. Mining continues in the old, upper areas of themine, while the new mine project is completed. Recovered grades increased during fiscal 2007,resulting in an average of 0.174 in fiscal 2007, compared to the average of 0.173 in fiscal 2006.
The increase in labor rates and inflation were the main contributors to the increase in cashcost from U.S.$523 per ounce in fiscal 2006 to U.S.$527 per ounce in fiscal 2007.
Tons milled from the Elandsrand shaft were 981,000 in fiscal 2008, compared with 1,117,000 infiscal 2007, and ounces sold were 158,631 in fiscal 2008, compared with 194,710 in fiscal 2007.Volumes were negatively affected, mainly as a result of days lost to the shaft accident, namely 42,and the continued lack of flexibility in face length to deal with erratic face grades andseismicity. The recovered grade declined during fiscal 2008 as a result of higher channel widths onthe Western section of the mine, as well as a delay in starting up some of the higher grade areas,due to it taking longer than expected to bring the environmental conditions within standard indeeper mining areas, after the shaft incident in October 2007.
The increase in labor rates and inflation were the main contributors to the increase in cashcost from U.S.$527 per ounce in fiscal 2007 to U.S.$652 per ounce in fiscal 2008. Costs per ouncehave increased in fiscal 2008 by 24%, due primarily to the reduced ounces as a result of the shaftincident causing the mine to stand for 42 days. Increases in the costs of labor and supplies,especially steel and the effect of inflation on supply contracts further contributed to theincrease in cash cost. Electricity increases in excess of current inflation also negativelyimpacted on costs.
Elandsrand currently operates one production shaft, with a current hoisting capacity of190,000 tons per month which will be utilized to its full capacity, once the Elandsrand New MineProject is complete and production build reaches its maximum. The average tons milled in fiscal2008 was 81,750 tons per month.
On a simplistic basis, assuming no additional reserves are identified, at expected productionlevels, it is foreseen that the reported proven and probable ore reserves of 44.4 million tons (8.6million ounces) will be sufficient for the Elandsrand shaft to maintain underground productionuntil approximately calendar year 2026. Any future changes to the assumptions upon which the orereserves are based, as well as any unforeseen events affecting production levels, could have amaterial effect on the expected period of future operations
Capital Expenditure: We incurred approximately R318.4 million (U.S.$43.8 million) in capitalexpenditures at the Elandsrand operations in fiscal 2008 mainly for the sub shaft deepening projectand ongoing development.
45
We have budgeted R433.6 million (U.S.$59.7 million), for capital expenditures at the Elandsrandoperations in fiscal 2009, primarily for the sub-shaft deepening project and ongoing developmentexpenditure.
Masimong
Introduction: Masimong is located in the Free State province, near Riebeeckstad. The Masimongcomplex comprises of Masimong 4 and 5 shaft. Mining is conducted at depths ranging from 1,518meters to 1,994 meters. Ore is treated at the Central Plant and FS 1 Plant.
History: Masimong is located in the Free State Goldfield on the south-western edge of theWitwatersrand Basin. We purchased the Masimong complex (formerly know as Saaiplaas Shafts 4 and 5)on September 1998.
Geology: Masimong is located in the Free State Goldfield on the south-western edge of theWitwatersrand Basin. The operation, which originally exploited the Basal Reef, is also miningsecondary reefs, most notably the Leader Reef (15-20m above Basal), the B Reef (100m above Basal)and the A Reef (40m above the B Reef). Harmony 2 is continuing to mine high grade Basal Reefpillars, as well as Leader Reef, but the majority of its production comes from the A Reef. The AReef is highly channelized and mining is confined to these distinct channels. Dips are shallowtowards the east, becoming steeper approaching the De Bron Fault in the west.
Mining Operations: The operations are subject to the underground mining risks detailed in the RiskFactors section. Due to the shallow to moderate depths of the underground operations, seismicityrelated problems are relatively infrequent. We regularly revisit our mining strategy and managementprocedures in connection with our efforts to mitigate risks of these problems. There is a risk ofsubterranean water and/or gas intersections in some areas of the mine. However, this risk ismitigated by active and continuous management and monitoring, which includes the drilling ofboreholes in advance of faces. Where water and/or gas is indicated in the drilling, appropriatepreventative action is taken. The principal challenges at the operations of achieving optimalvolumes and grades of ore production are addressed by stringent ore reserve management.
In fiscal 2002, we began implementing the Masimong Expansion Project, which includesdeveloping the Basal and B Reef orebodies in the Masimong shaft area and equipping the shaft. Theenvisaged growth from the project was not realized in 2005 and 2006, and as a result the projectwas halted in June 2006. Conops was implemented in the third quarter of fiscal 2006 but, after areassessment, was stopped at Masimong 5 Shaft during the second quarter of fiscal 2008.
In fiscal 2008, Masimong accounted for approximately 6% (7% in fiscal 2007 and 6% in fiscal2006) of our total gold sales.
Safety: The safety record at Masimong during fiscal 2008 in terms of LTFR of 9.57 per million hoursworked compared favorably with the group average of 12.83. The FFR of 0.12 at Masimong comparedfavorably with the group average of 0.18 for underground operations.
Plants: Ore from Masimong is treated at the Central and Saaiplaas plants. See Item 4. “SouthAfrican Mining Operations — Virginia Operations — Plants”.
Production analysis:
| | | | | | | | | | | | | |
| | | Fiscal Year Ended June 30, |
| Masimong Shaft Complex | | 2008 | | 2007 | | 2006 |
Production | | | | | | | | | | | | |
Tons (‘000) | | | 892 | | | | 1,074 | | | | 1,020 | |
Recovered grade (ounces/ton) | | | 0.132 | | | | 0.138 | | | | 0.133 | |
Gold sold (ounces) | | | 117,575 | | | | 147,958 | | | | 136,153 | |
Results of operations (millions) ($) | | | | | | | | | | | | |
Product sales | | | 96 | | | | 95 | | | | 73 | |
Cash cost | | | 88 | | | | 82 | | | | 67 | |
Cash profit | | | 8 | | | | 13 | | | | 6 | |
Cash costs | | | | | | | | | | | | |
Per ounce of gold ($) | | | 745 | | | | 559 | | | | 489 | |
Capex (millions) ($) | | | 16 | | | | 15 | | | | 14 | |
Tons milled from the Masimong shaft complex were 1,074,000 in fiscal 2007, compared with1,020,000 in fiscal 2006, and ounces sold were 147,958 in fiscal 2007, compared with 136,153 infiscal 2006. Year on year production was slightly higher with a slightly higher recovery grade.
46
Cash costs were U.S.$82 million in fiscal 2007 compared with U.S.$67 million in fiscal 2006with cash costs per ounce at U.S.$559 in fiscal 2007 compared with U.S.$489 in fiscal 2006. Thisincrease in cash cost is mainly attributable to increase in labor costs as a result of the annualwage increases as well as a 21% increase in number of employees. This increase in people was tofully staff the operation for Conops. This was the first year that Masimong was fully on a Conopscycle. The effect of Conops is increased costs in the short-term as additional people are utilizedwithout being fully operational, but increased profitability in the longer-term as higher volumeshave a positive impact on the bottom-line.
Tons milled from the Masimong shaft complex were 892,000 in fiscal 2008, compared with1,074,000 in fiscal 2007. Ounces fold were 117,575 in fiscal 2008, compared with 147,958 in fiscal2007. This is mainly attributable to the reduction in tons milled.
The drop in recovered grade by 0.006 ounces per ton from fiscal 2008 to fiscal 2007 can beattributed to a 2.63% drop in grade mined and a 0.715% drop in the mine call factor. Both theseparameters were negatively influenced by the B Reef, as mining of B Reef in fiscal 2008 wassignificantly focussed in the South Eastern portion of the 5 shaft lease area. This area istypically a highly channelized deposit with economic channels occuring at oblique to perpendicularangles to the normal depositional axis of the B Reef. These channels are generally small measuredon the latitudinal axis and highly unpredictable, thus making mining and valuation extremelydifficult.
Cash costs were U.S.$88 million in fiscal 2008 compared with U.S.$82 million in fiscal 2007with cash costs per ounce at U.S.$745 in fiscal 2008 compared with U.S.$559 in fiscal 2007. Thisincrease in cash cost is mainly attributable to increase in labor costs as a result of the annualwage increases.
The total shaft hoisting capacity is 134,000 tons per month. The average tons milled in fiscal2008 were 74,354 tons per month.
The Conops production cycle was stopped on Masimong in December 2007. Through restructuringand reengineering, the excess labor was identified and relocated to other shafts. This process wascompleted in March 2008. Additional Conops costs were incurred during the phasing out period(lower production with the full complement of Conops labor).
The year on year decrease in tonnage from fiscal 2007 to fiscal 2008 is a result of theabovementioned stoppage of Conops The mine plan was revised during January 2008 to adjust to thenon-Conops production cycle.
During the initial stages of restructuring significant production upsets were encountered dueto the redeployment of mine employees and termination of contractors and labor hire employees.
This upset was especially evident in the March 2008 quarter, when production dropped to160,832 tons which equates to a 20.7% drop from the previous (December 2007) quarter. the June2008 quarter was the first full normalized production quarter after the stoppage of Conopsproduction cycle.
On a simplistic basis, assuming no additional reserves are identified, at expected productionlevels, it is foreseen that the reported proven and probable ore reserves of 5.1 million tons (0.8million ounces) will be sufficient for the Masimong shaft complex to maintain undergroundproduction until approximately fiscal 2018. Any future changes to the assumptions upon which thereserves are based, as well as any unforeseen events affecting production levels, could have amaterial effect on the expected period of future operations.
Capital Expenditure: We incurred approximately R114.0 million (U.S.$15.7 million) in capitalexpenditures at Masimong in fiscal 2008. We have budgeted a total of R109.4 million ($15.0 million)for capital expenditures at Masimong in fiscal 2009. Of this, R17.0 million (U.S.$2.3 million) isfor upgrading of the rail bound equipment, with the remainder budgeted for ongoing development.
Virginia operations
Introduction: The Virginia operations are located in the Free State province, near Virginia. TheVirginia operations consist of the original Harmony mines, the Unisel mine, Brand shafts 2, 3 and5. Mining is conducted at these operations at depths ranging from 682 meters to 2,042 meters. Oreis treated at the Central Plant and FS 1 Plant.
History: Our operations in the Free State began with the Harmony mine, which is an amalgamation ofthe Harmony, Virginia and Merriespruit mines. Beginning in 1996, we began purchasing neighboringmine shafts. The Unisel mine was purchased in September 1996, the Saaiplaas mine Shafts 2 and 3were purchased in April 1997, the Brand mine Shafts 2, 3 and 5 were purchased in May 1998.
47
Geology: These operations are located in the Free State Goldfield on the south-western edge of theWitwatersrand Basin. The operations, which originally exploited the Basal Reef, are also miningsecondary reefs, most notably the Leader Reef (15-20m above Basal), the B Reef (100m above Basal)and the A Reef (40m above the B Reef). Harmony 2 is continuing to mine high grade Basal Reefpillars, as well as Leader Reef, but the majority of its production comes from the A Reef. The AReef is highly channelized and mining is confined to these distinct channels.
Merriespruit 1 is exploiting the Basal and Leader reefs, as well as locally developed highgrade Middle Reef pockets. The mining operations of the Middle Reef was discontinued during 2008at Merriespruit 1 shaft. Dips at Merriespruit 1 shaft tend to be at 8° to the north west withnumerous east west trending Faults/Dykes which cut through the shaft pillar , the “Dolfin Sill”which disrupt the reef horizoning the north east and the De Bron Fault in the west. Merriespruit 3shaft is mining Leader and Basal reef, with the majority being concentrated on the Leader reef dueto the fact that a large area of the shaft is beyond the zone of convergence with the Basal reef.Dips tend to be between 10° and 20° to the Northwest. The structure is fairly complicated with theDe Bron fault in the west, the Virginia fault in the east and the Merriespruit thrust fault in thesouth, resulting in significant strike and dip changes and large overlapping reef blocks.
At Unisel, the Basal, Middle and Leader Reefs are mined, with reefs dipping 30° to the east.The structure is complex due to a number of north-south trending faults as well as sills close tothe Basal Reef. Brand 1/3 is mining Basal pillars together with the A Reef. The structure isdominated by north-south trending faults, often with lateral shift. Brand 2 and 5, currently oncare and maintenance, have mined mostly Basal and Leader Reefs.
Mining Operations: The operations are subject to the underground mining risks detailed in the RiskFactors section. Due to the shallow to moderate depths of the underground operations, seismicityrelated problems are relatively infrequent with the exception of Unisel and Harmony shafts andMerriespruit 1 shaft pillar, where these problems receive constant attention. We regularly revisitour mining strategy and management procedures in connection with our efforts to mitigate risks ofthese problems. There is a risk of subterranean water locally at Merriespruit 1, referred to aswater pillar area, and/or gas intersections in some areas of the mine. However, this risk ismitigated by active and continuous management and monitoring, which includes the drilling ofboreholes in advance of faces. Where water and/or gas is indicated in the drilling, appropriatepreventative action is taken. The principal challenges at the operations of achieving optimalvolumes and grades of ore production are addressed by stringent ore reserve management.
Development was restarted at the Virginia operations in 2006, a positive life of mine has beenre-established on all the shafts and the shafts have returned to profitability.
Merriespruit 1 installed a “floating” shaft tower in the shaft barrel in 2005, to allow miningof the shaft pillar. Mining of the inner shaft pillar commenced in October 2006 and is beingsuccessfully mined. Approximately 70% of the pillar is mined out.
Merriespruit 3 shaft improved its haulage and tramming conditions during fiscal 2007 and 2008,allowing the shaft to improve its safety and tonnage profile. Equipping of basal reef on 12 leveltook place during 2008 and limited mining of the basal reef will resume for the first time since2002.
Harmony 2 shaft re-started the H2 shaft pillar Leader reef exploration program in 2005,following the improvement in the gold price. This ground has been successfully mined and theextension of the pay shoot towards H3 shaft is currently being explored. The evaluation andquantification of the “A reef vent” project block were completed in 2007 (drilling etc.) anddevelopment started in 2008. Basal reef pillars belonging to Merriespruit 1 are being accessedthrough the shaft. The 1st pillar is currently being mined and equipping towards furtherpillars is ongoing.
Brand 1 shaft is being utilized to mine the Brand 1 and 3 ore bodies. Major effort has beendone to improve the infrastructure of the shaft, which has allowed the shaft to improve its tonnagehandling to the current levels of some 44 000t per month. A loop is currently being developed inthe 40 level haulage to allow access to the A reef in the Brand 3 area. This will allow improvedservicing of the area and a 2,5 Km reduction in tramming distances.
At Brand mine the grade remained constant year on year at 0.103g/t, while the tonnage increasedfrom 445,000 tons to 459,000 tons. This resulted in an increased gold production, up from 45611oz’s in 2007 to 47101 oz,s in 2008. The tonnage increased as a result of improved efficiencies in2008 in spite of Eskom power supply problems in the second half of the production year.
48
Unisel experienced a decrease in tonnage from 614,000 tons in 2007 to 547,000 tons in 2008. Thiswas primarily a consequence of the Eskom power cuts in February and lower subsequent production asa result of power restrictions. At the same time the mine experienced a decline in grade from 0.130in 2007 to 0.124 in 2008 due to the depletion of higher grade Middle Reef panels. The combinedfactors of tonnage and grade led to the decrease in ounces from 79,992 in 2007 to 67,613 in 2008
The Brand 2 and Brand 5 Shafts are currently on care and maintenance whilst Brand 5 serves as amajor pumping shaft for the President Steyn, Brand, Bambanani and Unisel mining areas. Harmony 3shaft is currently used only as a service shaft for pumping although some of its reserves are minedthrough the adjacent Harmony 2 shaft.
In fiscal 2008, Virginia operations accounted for approximately 13% (12% in fiscal 2006 and2007) of Harmony’s total gold sales.
Safety: The safety record during fiscal 2008 in terms of LTFR of 19.79 per million hours workedcompared unfavorably to the group average of 12.83. The FFR of 0.20 compared unfavorably to thegroup average of 0.18 for underground operations.
Plants: There are two metallurgical plants at the Free State operations, namely Central andSaaiplaas plants. A third plant, Virginia plant, was closed in fiscal 2005 and clean-up operationsimplemented and, during fiscal 2008, a project was initiated on the demolition of the plant whichwill continue through into fiscal 2010. The Central plant was commissioned in 1986 and employsCIP/CIL hybrid technology. It is currently dedicated to the treatment of both underground ore andwaste rock. The Saaiplaas plant, commissioned in the late 1950’s, has been converted from the zincprecipitation filter process to the CIL. It currently processes reclaimed slime at 6 million tonsper annum.
The following table sets forth processing capacity and average tons milled during fiscal 2008for each of the plants:
| | | | | | | | | |
| | | | | | | Average Milled |
| | | | | | | for the Fiscal Year |
| | | Processing | | Ended |
| Plant | | Capacity | | June 30, 2008 |
| | (tons/month) | | (tons/month) |
Central | | | 168,000 | | | | 141,500 | |
Saaiplaas | | | 500,000 | | | | 583,650 | |
In fiscal 2008, our Central plant recovered approximately 95% of the gold contained in the oredelivered for processing and approximately 48.7% at the Saaiplaas plant.
| | | | | | | | | | | | | |
| | | Fiscal Year Ended June 30, |
| Virginia operations | | 2008 | | 2007 | | 2006 |
Production | | | | | | | | | | | | |
Tons (‘000) | | | 2,349 | | | | 2,507 | | | | 2,368 | |
Recovered grade (ounces/ton) | | | 0.107 | | | | 0.106 | | | | 0.117 | |
Gold sold (ounces) | | | 250,324 | | | | 266,948 | | | | 276,285 | |
Results of operations (millions) ($) | | | | | | | | | | | | |
Product sales | | | 204 | | | | 172 | | | | 146 | |
Cash cost | | | 180 | | | | 147 | | | | 135 | |
Cash profit | | | 24 | | | | 25 | | | | 11 | |
Cash costs | | | | | | | | | | | | |
Per ounce of gold ($) | | | 719 | | | | 546 | | | | 487 | |
Capex (millions) ($) | | | 20 | | | | 19 | | | | 14 | |
Tons milled from the Virginia operations increased to 2,507,000 in fiscal 2007, compared with2,368,000 in fiscal 2006. This is partially attributable to the increase in volumes at Merriespruit1, mainly as a result of being able to commence mining in the shaft pillar area, after completionof the shaft tower installation project.
49
Equipping and development was enhanced enabling entry to panels at an increased rate. Alsocontributing to this increase in tons milled was the improved blasting frequency at Unisel. Thisincrease was offset by a decrease in tons milled of 81,000 at Harmony 2, primarily due to anunderground fire experienced in the Basal pillar.
Ounces sold were 266,948 in fiscal 2007, compared with 276,285 in fiscal 2006. The decrease inounces sold was negatively influenced by the lower grade. Contributing to the decrease in averagegrade was the fire in the high grade basal pillar area at Harmony 2, where the grade decreased from0.116 in fiscal 2006 to 0.089 in fiscal 2007. The erratic grade of the Middle reef at Merriespruit1 also attributed to the decrease in grade. The negative impact of the grade on the ounces sold waspartially offset by the increase in ounces sold from the other operations, mainly due to anincrease in volumes.
Cash costs were U.S.$147 million in fiscal 2007, compared with U.S.$135 million in fiscal2006. This increase was primarily attributed to higher production levels and an increase in laborcost. Included is approximately R3.1million (U.S.$0.4 million) for costs to fight the fire atHarmony 2 and replace critical items lost in the fire. Merriespruit 1 experienced an increase incosts as a result of the additional support required in the shaft pillar area. At Unisel,additional costs were incurred for upgrade of the refrigeration plant and infrastructure. Cashcosts per ounce were U.S.$546 in fiscal 2007, compared with U.S.$487 in fiscal 2006. This increasewas attributable primarily to a lower recovery grade resulting in lower ounces as well as anincrease in cash costs.
Tons milled from the Virginia operations decreased from 2,507,000 in fiscal 2007 to 2,349,000in fiscal 2008. A fire at Merriespruit 1 affected production in the first quarter of fiscal 2008 andalso adversely affected the flexibility at this operation. Labor shortages and power outages alsoaffected production negatively in the latter part of the year. Industrial action by labor unionsled to loss of production shifts. Stoping restrictions as recommended by rock engineers affectedproduction in the pillar areas.
Lack of availability of replacement ground at Merriespruit 3 also impacted negatively on thevolumes for fiscal 2008. Stoping width restrictions to 2.5m by Rock engineering recommendations,adversely affected both tons and gold content (less channel exposure resulting in lower goldcontent, and lower stope width in lower tons.) The marginality of the ore body and the subsequentstop-start history of the development on the shaft during periods of lower gold price have createdan availability and flexibility problem on the shaft. Labor availability was problematic, with lessthan planned crews available for a significant period of the year. (17 out of 18 crews) Thelocation and opening of the downdip extension of a wide leader pay shoot and a change of miningdirection to parallel the pay trend to reduce the crew moves proved successful.
Harmony 2 shaft was affected by power shortages during the third quarter resulting in a numberof lost production shifts. Coupled with this was an incident at the substation at Harmony 2 Shaftwhich led to a loss of 2 shifts in March 2008. Seismicity in high grade basal pillars leading to adrop in the face grade and production stoppages during fiscal 2008. A low strike rate fromdevelopment led to a slow opening up of payable reserves resulting in a lack of flexibility. Laborshortages were also experienced especially after the Voluntary Retrenchment Scheme during which nooutside labor could be hired as replacement prior to the relocation of labor from other Harmonyshafts.
Ounces sold were 250,524 in fiscal 2008, compared with 266,948 in fiscal 2007. The decrease inounces was primarily due to a decrease in tons milled. The grade for fiscal 2008 of 0.107 wassimilar to the recovered grade of 0.106 for fiscal 2007.
Cash costs were U.S.$180 million in fiscal 2008, compared with U.S.$147 million in fiscal2007. This can be partly attributed to an increase in labor cost as well as costs at Merriespruit 1for additional support required in the shaft pillar area and the cost related to the fire in thefirst quarter. Cash costs per ounce were U.S.$719 in fiscal 2008, compared with U.S.$546 in fiscal2007. This increase was attributable primarily to increased labor rates and inflationaryescalations as well as the decrease in ounces produced.
The upgrading of the old infrastructure at Brand 3 and Unisel during fiscal 2008 led to theincrease in their cash cost. Labor in fiscal 2008 on Brand 3 increased due to the inclusion ofequipping crews to assist with the opening up of old areas, which were previously stopped. This ledto the increase in the tons and an increase in plant costs. The inclusion of the Bobebe employees,previously carried by Central Services contributed to the increase in our cash costs. The upgradingof rails and the loco conversions on Unisel and Brand 3, to comply to new railboundspecifications, also contributed to the higher cash costs in fiscal 2008.
On a simplistic basis, assuming no additional reserves are identified, at expected productionlevels, it is foreseen that the reported proven and probable ore reserves of 8.5 million tons (1.1million ounces) will be sufficient for the Virginia operations to maintain production untilapproximately 2015. However, any future
50
changes to the assumptions upon which the reserves are based, as well as any unforeseen eventsaffecting production levels, could have a material effect on the expected period of the futureoperations.
Capital Expenditure: We incurred approximately R152 million (U.S.$20 million) in capitalexpenditures at the Virginia operations in fiscal 2008, principally for ongoing capitaldevelopment. We have budgeted R138 million (U.S.$18 million) for ongoing capital development infiscal 2009, as well as R7 million (U.S.$0.9 million) for upgrading rail bound equipment. Anadditional R10 million (U.S.$1 million) has been earmarked for various drilling explorationprojects.
Target
Introduction: We acquire the Target mine when Avgold became a wholly owned subsisdiary in fiscal2004. Target is situated near the town of Allanridge in the Free State Province, some 270kilometers southwest of Johannesburg. Located at approximately latitude 28 (LOGO) 00’S andlongitude 26 (LOGO) 30’E on the northern limit of the Welkom Goldfields, the site is accessed viathe R30 motorway situated between the towns of Bothaville and Welkom.
History: The Target Operations area was initially explored through surface drilling in the late1980s with further exploration being undertaken from a 5.6 kilometers long decline, commenced in1995, driven from 203L at Lorraine No. 1 Shaft. A positive feasibility study into the developmentof a 105 ktpm operation was produced in May 1998 resulting in the decision to develop the Targetmine. A detailed mine design was produced in 2000 and the mine officially opened in May 2002. Uponclosure of the Lorraine mine in August 1998, the Lorraine No. 1 and No. 2 Shafts were transferredto the Target mine, becoming Target No. 1 and No. 2 Shafts, respectively.
Geology: The gold mineralization currently exploited by Target mine is contained within asuccession of Elsburg and Dreyerskuil quartz pebble conglomerate reefs hosted by the Van Heeverrustand Dreyerskuil Members of the Eldorado Formation, respectively. Additional mineral resources havebeen delineated in the Big Pebble Reefs of the Kimberley Formation but these are not planned to beexploited in the current life of mine plan.
The majority of the mineral reserves at Target mine are contained within the Eldorado fan, astructure with dimensions of some 135 meters vertically, 450 meters down-dip and 500 meters alongstrike. The Eldorado fan is connected to the subsidiary Zuurbron fan, located between the Targetmine and Lorraine, by a thinner and lower grade sequence of Elsburg reefs termed the Interfan area.To the north of the Eldorado fan, a number of fans have been intersected by surface drilling ofwhich the Siberia and Mariasdal fans are the most significant. These fans are subject to ongoingtechnical studies and do not form part of the current Target mine life of mine mineral reserve.
A number of faults that displace the reefs of the Target mine have been identified of which themost prominent are the north-south trending Eldorado fault and the east-west trending Dam and Blastfaults. The Eldorado uplifts the more distal portions of the Elsburg and Dreyerskuil Reefs whilethe Blast fault forms the northern border of the Target mine.
Target North is sub-divided into the Paradise, Siberia and Mariasdal areas by the east-westtrending Siberia and Mariasdal faults. To the north of the Siberia fault, the Eldorado faultcontinues trending more to the northwest and an additional north-south trending fault, the Twinfault has uplifted the distal portions of the reefs. North of the Maraisdal fault, the reefhorizons are at a depth greater than 2,500 meters below surface. Resources have been delineated onstrike up to 15 kilometers north of the Target mine
Approximately 40 kilometers north of Target mine, surface boreholes have intersected goldbearing reefs in the Oribi area close to the town of Bothaville. Resources have been delineated atOribi on the VCR and Elsburg at depths of approximately 2,750 meters below surface.
Mining operations: Target is subject to the risks associated with underground mining detailed inthe Risk Factors section.
Mining operations comprise one primary underground mine commissioned in May 2002, making useof information systems and mechanization, combined with process-driven organizational design thatrelies on a multi-skilled workforce. The majority of the production is derived from mechanizedmining; however, conventional stoping is still employed primarily to de-stress areas ahead of themechanized mining.
In fiscal 2008, Target experienced a number of issues, including falls of ground, flooding,the low availability of mechanized equipment and belt systems and poor fragmentation in the massivestopes. These all contributed to significantly reduce volumes and flexibility. The mine also
51
continuedto contend with issues such as grade and grade estimation, an area which received a great deal of attention in the lastquarter, and which showed signs of improvement.
Some of the new trackless fleet arrived in the second half of fiscal 2008 and the waterhandling problems (that caused flooding of the ends) had largely been addressed by June 2008.
In fiscal 2008, Target’s operations accounted for 4% of our total gold sales (6% in fiscal years2007 and 2006).
Safety: The safety record at Target during fiscal 2008 in terms of lost time frequency rate of10.76 per million hours worked compared favorably with the group average of 12.83 while thefatality frequency rate of 0.0 compared favorably with the group average of 0.18 for undergroundoperations.
Safety at the operations receives constant and high-level attention and where problems areidentified steps are taken to address the situation.
Plants: Target Plant was commissioned towards the end of 2001, and currently treats bothunderground ore and surface waste rock dump. The process route comprise primary crushing, opencircuit primary SAG milling, secondary ball milling closed with hydrocyclones, thickening, cyanideleaching, CIP adsorption, elution, electrowinning, smelting and tailings disposal. The millingcircuit incorporates gravity concentration, the concentrates from which are processed via intensivecyanidation and electrowinning.
The installation of a ROM mill to enable the mills to run autogenously is complete and the ROMmill was commissioned in November 2007. The total project capital expenditure was R22 million(U.S.$3 million). The objective is to save R 1.2 million on grinding media monthly. All capital onthis project has been spent and the project was closed during May 2008.
The following table sets forth processing capacity and average tons milled during fiscal 2008:
| | | | | | | | | |
| | | | | | | Average Milled For the |
| | | Processing | | Fiscal Year Ended |
| Plant | | Capacity | | June 30, 2008 |
| | (tons/month) | | (tons/month) |
Target Plant | | | 105,000 | | | | 97,973 | |
In fiscal 2008, the Target Plant recovered approximately 96% of the gold contained in the oredelivered for processing.
Production analysis:
| | | | | | | | | | | | | |
| | | Fiscal Year Ended June 30, |
| Target | | 2008 | | 2007 | | 2006 |
Production | | | | | | | | | | | | |
Tons (‘000) | | | 686 | | | | 904 | | | | 813 | |
Recovered grade (ounces/ton) | | | 0.124 | | | | 0.158 | | | | 0.185 | |
Gold sold (ounces) | | | 85,006 | | | | 142,433 | | | | 150,196 | |
Results of operations (millions) ($) | | | | | | | | | | | | |
Product sales | | | 69 | | | | 91 | | | | 81 | |
Cash cost | | | 51 | | | | 53 | | | | 52 | |
Cash profit | | | 18 | | | | 38 | | | | 29 | |
Cash costs | | | | | | | | | | | | |
Per ounce of gold ($) | | | 605 | | | | 370 | | | | 346 | |
Capex (millions)($) | | | 35 | | | | 16 | | | | 10 | |
Tons milled from the Target shaft increased to 904,000 in fiscal 2007, compared with 813,000in fiscal 2006. The age of the current fleet (vehicles) is of a big concern.
Ounces sold were 142,433 in fiscal 2007, compared with 150,196 in fiscal 2006. The decrease inounces sold, was negatively influenced by the lower grade. The recovery grade decreased from 0.185in fiscal 2006 to 0.158 in fiscal 2007.
52
Cash costs for Target were U.S.$53 million in fiscal 2007, compared with U.S.$52 million infiscal 2006. This increase was primarily attributed to higher production levels, and an increase inlabor cost. Cash costs per ounce were U.S.$370 in fiscal 2007, compared with U.S.$346 in fiscal2006. This increase was attributable primarily to a lower recovery grade as well as an increase incash costs.
Tons milled from the Target shaft decreased from 904,000 in fiscal 2007 to 686,000 in fiscal2008. The main issues contributing to the drop in production include trackless fleet availability,flooding of mining block, fragmentation problems in massive stopes and lack of face lengthespecially for massive stopes. Problems encountered in the massive stopes were the maincontributor to grade and volume decreases.
Ounces sold were 85,006 in fiscal 2008, compared with 142,433 in fiscal 2007. The decrease inounces sold was negatively influenced by the lower grade. The recovery grade decreased from 0.158in fiscal 2007 to 0.124 in fiscal 2008.
Cash costs for Target were U.S.$51 million in fiscal 2008, compared with U.S.$53 million infiscal 2007. This decrease was primarily attributed to lower production levels. Cash costs perounce were U.S.$605 in fiscal 2008, compared with U.S.$370 in fiscal 2007. This increase wasattributable primarily to a lower recovery grade.
The fleet replacement project is progressing well and it is expected to have a newer fleetwith better availability by December 2008. The flooding problems are largely due to inferior damcapacity and pumping infrastructure at the main dam. A new dam is being constructed and isexpected to be completed by March 2009. In the interim period, the current dam and pumpingarrangements have been upgraded and the risk of flooding will be reduced significantly by September2008. Fragmentation in the massive stopes was as a result of excessive hydraulic radius used in theplanning phase. This has been addressed and all new massive stopes that have come into operationfrom July 2008 are at smaller dimensions to address the fragmentation issue.
The focus for fiscal 2009 will be the development of the new decline to access the Block 3area which contains 40% of the mines gold reserves. Production is expected to be a steady state of65 000 tonnes per month for the next two years after which we expect to ramp up to the 80 000tonnes per month at a grade of 5.5g/t to 6g/t.
The Target shaft’s hoisting capacity is 110,000 tons per month. The average tons milled infiscal 2008 was 57,259 tons per month.
On a simplistic basis, assuming no additional reserves are identified, at expected productionlevels, it is foreseen that the reported proven and probable ore reserves of 21.9 million tons(4.25 million ounces) will be sufficient for the Target shaft to maintain production untilapproximately 2028. However, any future changes to the assumptions upon which the reserves arebased, as well as any unforeseen events affecting production levels, could have a material effecton the expected period of the future operations.
Capital Expenditure: We incurred approximately R257 million (U.S.$35 million) in capitalexpenditures at the Target shaft in fiscal 2008, principally for underground development and thereplacement of the underground fleet. We have budgeted R370 million (U.S.$51 million) for capitalexpenditures at Target in fiscal 2009, primarily for underground development, as well as thereplacement of the underground vehicles.
Evander Operations
Introduction: The Evander operations are located in the province of Mpumalanga in South Africa andare comprised of an amalgamation of the former Kinross, Bracken, Leslie and Winkelhaak mines and36,898 hectares of mineral rights adjacent to these mines. Mining at our Evander operations isconducted at depths ranging from 300 meters to 2,100 meters.
History: Gold mining in the Evander Basin began in 1955. Eventually, four mining operations wereestablished at Evander. In 1996, as a result of depletion of ore reserves, all four mining areaswere merged to form Evander. In August 1998, we acquired Evander as a wholly-owned subsidiary.
Geology: The area covered by Evander’s mining authorization and mineral rights is situated withinthe Evander basin, a geologically discrete easterly extension of the main Witwatersrand Basin. Onlyone economic placer unit, the Kimberley Reef, is mined at Evander. In addition to the faulting ofthe reef horizon, there are numerous dykes and sills that complicate the mining layouts, the mostsignificant of which is an extensively developed dolerite footwall sill that occasionallyintersects the Kimberley Reef, causing displacements within it.
Mining Operations: The Evander operations are primarily engaged in underground mining. The Evanderoperations also process a limited amount of waste rock as and when necessary to allow the plants tooperate efficiently. These operations are subject to the underground mining risks detailed in theRisk Factors section.
53
Due to the shallow to moderate depths of the Evander underground operations, seismicity andpressure high rock stress-related problems are relatively infrequent. There is a risk ofsubterranean water and/or gas intersections in some areas of the mine. However, this risk ismitigated by active and continuous management and monitoring, which includes the drilling ofboreholes in advance of faces. Where water and/or gas is indicated in the drilling, appropriatepreventative action is taken. In fiscal 2004, an agreement was reached with the unions for theimplementation of Conops at Evander. Downsizing and restructuring of the 7 Shaft area resulted inlabor surpluses and it was also decided to stop Conops in fiscal 2008 at Evander 5 shaft. Parts ofEvander 8 shaft continue to work on Conops.
During fiscal 2005, the Evander 2 and 5 Shafts were combined and downscaled, while the Evander9 Shaft was closed successfully and placed on care and maintenance. The Evander 9 Shaft employeeswere transferred to other Evander operations. The Evander 7 Shaft (Decline No. 3, phase 3) projectwas terminated in fiscal 2008.
Potential exists at several areas in Evander:
Evander South
| | • | | Project currently at an exploration stage following the prefeasibility study; |
| |
| | • | | Surface exploration drilling to be carried out in order to improve qualityof and confidence in the current estimate; and |
| |
| | • | | Drilling to commence in October 2008. |
Shaft 7 portion of the 2010 Payshoot.
| | • | | Project at an initial exploration stage following the geological study; |
| |
| | • | | Underground development and drilling, underground and from surface, is planned inorder to investigate the 7 Shaft flank of the postulated payshoot; and |
| |
| | • | | Feasibility study to follow, pending confirmation of the ore resource in this area. |
Twistdraai and Shaft 6
| | • | | Joint Venture with the African Precious Minerals (“APM”) is being formed toexplore these two target areas; |
| |
| | • | | APM is going to earn in the 52% equity stake upon completion of the fullbankable feasibility study for each area; and |
| |
| | • | | The geological studies are under way and drilling will commence in fiscal 2009. |
Rolspruit
| | • | | It is a future mining area of the current Shaft 8; |
| |
| | • | | Pre-feasibility study is being updated with more recent cost and gold price factors; and |
| |
| | • | | Synergies with the current Shaft 8 deepening could be considered. |
Poplar
| | • | | Surface exploration drilling is required to bring this project into the full bankable feasibility study; |
| |
| | • | | Pre feasibility study is due to be updated (after the Rolspruit study) with costs and gold pricefactors; and |
| |
| | • | | The surface exploration drilling at Evander South is likely to produce information that will enhancethe Poplar geological interpretation. |
In fiscal 2008, the Evander operations accounted for approximately 12% (10% in fiscal 2007 and12% in fiscal 2006) of our total gold sales.
Safety: The safety record at the Evander operations in terms of LTFR of 16.64 per million hoursworked during fiscal 2008 is unfavorable when compared to the group average of 12.83. The FFR of0.07 during fiscal 2008 is favorable when compared to the group average of 0.18 for undergroundoperations.
54
Plants: Evander has one active processing plant, the Kinross-Winkelhaak plant, which is operated astwo geographically distinct sections. Ore from Evander 7 and 8 is hoisted directly to and treatedat the Kinross plant, which is a CIL plant. All of the ore from Shafts 2 and 5 is milled andthickened at the Winkelhaak plant, and the slurry is pumped to the Kinross plant for furtherprocessing.
The following table sets forth processing capacity and average tons milled during fiscal 2008for the operating plant:
| | | | | | | | | |
| | | | | | | Average Milled for the |
| | | Processing | | Fiscal Year Ended |
| Plant | | Capacity | | June 30, 2008 |
| | (tons/month) | | (tons/month) |
Kinross-Winkelhaak | | | 200,000 | | | | 120,564 | |
In fiscal 2008, the plant at Evander operations recovered approximately 96.4% f the goldcontained in the ore delivered for processing.
Production analysis:
| | | | | | | | | | | | | |
| | | Fiscal Year Ended June 30, |
| Evander operations | | 2008 | | 2007 | | 2006 |
Production | | | | | | | | | | | | |
Tons (‘000) | | | 1,447 | | | | 1,667 | | | | 1,700 | |
Recovered grade (ounces/ton) | | | 0.166 | | | | 0.141 | | | | 0.161 | |
Gold sold (ounces) | | | 240,037 | | | | 235,443 | | | | 274,439 | |
Results of operations (millions) ($) | | | | | | | | | | | | |
Product sales | | | 193 | | | | 151 | | | | 142 | |
Cash cost | | | 127 | | | | 113 | | | | 111 | |
Cash profit | | | 66 | | | | 38 | | | | 31 | |
Cash costs | | | | | | | | | | | | |
Per ounce of gold ($) | | | 525 | | | | 481 | | | | 404 | |
Capex (millions) ($) | | | 33 | | | | 28 | | | | 26 | |
Tons milled at the Evander operations were 1,667,000 in fiscal 2007, compared with 1,700,000in fiscal 2006, and ounces sold were 235,443 in fiscal 2007, compared with 274,439 in fiscal 2006.The decrease in tons milled was due to the depletion of the open raise lines on 24 level at Evander5. The decrease in tons milled partially offset by an increase in tons from the mining of pillarareas at Evander 7 and 8. The decrease in ounces was due to the significantly lower production inreef tons as the shafts started to hoist waste with reef that dilutes the quality of the ore. AtEvander 7, the grade decreased, primarily due to the depletion of a very high grade pay shoot inthe No 3 decline areas and the increase in mining in the lower grade pillar area of the shaft. Therecovered grade at Evander 8 decreased as well as a result of payshoot variability due tosequential mining. The decrease in recovered grade was partially offset by an improvement of theMCF from 62% in 2006 to 70.5% in 2007 at Evander 5.
The increase in cash costs from U.S.$404 per ounce in fiscal 2006 to U.S.$481 per ounce infiscal 2007 was attributable primarily to the decrease in ounces produced as a result of thedecrease in recovery grade.
Tons milled at the Evander operations were 1,447,000 in fiscal 2008, compared with 1,667,000in fiscal 2007, and ounces sold were 240,037 in fiscal 2008, compared with 235,443 in fiscal 2007.The decrease in tons milled is partially attributable to the reduction of the development atEvander 7 in November 2007 and the closure of the pillars in the old mine in February 2008. AtEvander 8, tons milled decreased by 113,000 tons due to poorer environmental conditions in thedecline area which affected mining from this area. The shaft is currently busy with araise-borehole from 17 Level to 24 Level which will alleviate the medium term ventilationconstraints. Recovered grade was 0.166 in fiscal 2008, compared with 0.141 in fiscal 2007. Thehigher recovered grade is partially due to an improvement of the MCF at Evander 5 from 70,5% in2007 to 71,7% in 2008, as well as mining in higher grade areas at the shaft. At Evander 7 and 8,the closure of the more marginal pillar sections and focusing on the higher grade decline sectionsalso contributed to the higher recovered grade.
55
The increase in cash costs from U.S.$481 per ounce in fiscal 2007 to U.S.$525 per ounce infiscal 2008 was attributable primarily due to the increase in cash costs from U.S.$113 million infiscal 2007 to U.S.$127 million in fiscal 2008 as result of labor increases and inflation onconsumables and electricity increases in excess of current inflation. Excess employees from Evander7 in lieu of the restructuring as impacted negatively on the cash costs.
On a simplistic basis, assuming no additional reserves are identified, at expected productionlevels, it is foreseen that the reported proven and probable ore reserves of 11.2 million tons (1.9million ounces) will be sufficient for the Evander operations to maintain production untilapproximately fiscal 2027. Any future changes to the assumptions upon which the reserves are based,as well as any unforeseen events affecting production levels, could have a material effect on theexpected period of future operations.
Capital Expenditure: We incurred approximately R242 million ($33 million) in capital expendituresat the Evander operations in fiscal 2008. The expenditure was primarily for ongoing development aswell as deepening of the decline shaft systems at Evander 7 and 8. We have budgeted R174 million($22 million) for capital expenditures in fiscal 2009 primarily for ongoing development and theupgrading of major equipment. Included is also an amount for phases 6 and 7 of the No 2 decline atEvander 8 and two ventilation bore holes. The No 3 decline project at Evander 7 was stopped inNovember 2007.
Other — Underground
Introduction: Other — Underground consists of several shafts, including Joel and St Helena. As themost significant portion of the results from this segment is attributable to Joel, we have onlydisclosed the relevant information for Joel.
History: Joel was purchased from a subsidiary of AngloGold at the same time as the rest of theFreegold assets in January 2002.
Geology: The mine is located in the Free State Goldfield, which is on the southwestern edge of theWitwatersrand basin. Joel is located 30 kilometers south of Welkom and is mining the shallowflat-dipping Beatrix/VS5 Reef.
Mining operations: These operations are subject to the underground mining risks detailed in theRisk Factors section.
Mining takes place at an average depth of approximately 1,200 meters at Joel.
During fiscal 2008, Joel accounted for 3% of our total gold sales (3% in fiscal 2007 and 2% infiscal 2006
Safety: During fiscal 2008, the LTFR at Joel of 4.91 per million hours worked compared favorablywith the group average of 12.83. The FFR at Joel of 0.00 compared favorably with the group averageof 0.18.
Plants: The Joel plant is a hybrid CIP/CIL plant and was commissioned in 1987. During fiscal 2005,it was decided to close the Joel Plant and place the plant under care and maintenance. Afeasibility study is underway to investigate the possibility of reopening the Joel plant aroundJanuary 2009.
Production analysis:
| | | | | | | | | | | | | |
| | | Fiscal Year Ended June 30, | |
| Joel | | 2008 | | | 2007 | | | 2006 | |
Production | | | | | | | | | | | | |
Tons (‘000) | | | 449 | | | | 504 | | | | 436 | |
Recovered grade (ounces/ton) | | | 0.136 | | | | 0.158 | | | | 0.134 | |
Gold sold (ounces) | | | 61,215 | | | | 79,923 | | | | 58,595 | |
Results of operations (millions) ($) | | | | | | | | | | | | |
Product sales | | | 52 | | | | 51 | | | | 31 | |
Cash cost | | | 39 | | | | 33 | | | | 29 | |
Cash profit | | | 13 | | | | 18 | | | | 2 | |
Cash costs | | | | | | | | | | | | |
Per ounce of gold ($) | | | 639 | | | | 418 | | | | 498 | |
Capex (millions) ($) | | | 5 | | | | 4 | | | | 4 | |
56
Tons milled from Joel shaft increased to 504,000 in fiscal 2007, compared with 436,000 infiscal 2006, attributable primarily to the commissioning of the mineshaft loading arrangement on137 level. Tons milled were negatively influenced in fiscal 2007 due to ceasing hoisting operationsat North Shaft on March 15, 2007 for the sinking stage removal, guide rope installation and theinstallation of a proper spillage arrangement at shaft bottom. Ounces sold were 79,923 in fiscal2007, compared with 58,595 in fiscal 2006. The improved recovered grade and the increased tonspositively influenced ounces sold. Recovered grade improved to 0.158 in fiscal 2007 compared with0.134 in fiscal 2006.
Cash costs for Joel increased to U.S.$33 million in fiscal 2007, compared with U.S.$29 millionin fiscal 2006. This increase was primarily attributed to higher production volumes and increasedlabor costs to support the build-up in production. Cash costs per ounce were U.S.$418 in fiscal2007, compared with U.S.$498 in fiscal 2006. This decrease was primarily attributable to the higherproduction levels and an increased grade.
The decrease in tons milled from 504 000 in fiscal 2007 to 449 000 in fiscal 2008 is due tothe fact that the rehabilitation work on North Shaft was only completed at the end of October 2007.Consequent teething problems at North Shaft also impacted here, for instance shaft bottom cleaning,installation of ventilation pipes on platform, Winder motor burnout which resulted in a delay asanother motor had to be sourced from Anglogold Ashanti.
Grade was affected by long distance up dip scraping which was caused by change in hoistingfrom North to South Shaft due to South Shaft rehabilitation. Higher than expected stoping widthswas encountered which affected the face grams per ton. Joel has a centralised high grade area withthe outskirts being of lower grade. Due to no flexibility and availability Joel was forced to moveto the outskirts therefore causing a lower recovery grade.
Ounces sold were 61,215 in fiscal 2008, compared to 79,923 in fiscal 2007. This was mainly dueto a combination of lower tons milled as well as a lower recovery grade.
The increase in cash costs from U.S.$33 million in fiscal 2007 to U.S.$39 million in fiscal2008 is due to wage and salary increases granted to labor as well as an increase in the skilledlabor complement to address skills shortage on Joel. As Joel does not have its own plant, ore istransported to a plant in Virginia which is 33 kilometers away. This is done by means of trucks.Due to the increase in diesel, a fuel levy is charged to compensate the cartage contractor for thefuel increases. This also resulted in increased costs.
Cash costs for Joel increased to U.S.$39 million in fiscal 2008, compared with U.S.$33 millionin fiscal 2007. This increase was primarily attributed to increased labor costs. Cash costs perounce were U.S.$639 in fiscal 2008, compared with U.S.$418 in fiscal 2007. The increase wasprimarily attributable to the decrease in tonnage due to the re-equipping where after the shaft wasnot fully operational for the first two quarters of fiscal 2008.
The rock hoisting capacity at Joel is 180,000 tons per month. The average tons milled infiscal 2008 was 37,420 tons per month.
On a simplistic basis, assuming no additional reserves are identified, at expected productionlevels, it is foreseen that the reported proven and probable ore reserves of 4.1 million tons (0.6million ounces) will be sufficient for Joel to maintain underground production until approximately2017. Any future changes to the assumptions upon which the ore reserves are based, as well as anyunforeseen events affecting production levels, could have a material effect on the expected periodof future operations.
Capital Expenditure: We incurred approximately R39 million (U.S.$5.4 million) in capitalexpenditures at Joel in fiscal 2008, on development on 129 level, general replacement, maintenanceand ongoing development and have budgeted R24.0 million (U.S.$3.3 million) for 129 LevelDevelopment capital expenditures in fiscal 2009, and R15.4 million (U.S.$2.1 million) for ongoingdevelopment.
Other — Surface
Introduction: Other — Surface consists of Kalgold, Phoenix and the surface operations owned by theFreegold and Avgold companies. As the results of operations for Other — Surface consists primarilyof the results from Kalgold and Phoenix, these two operations have been discussed separately.
Kalgold
Introduction: We conduct a surface mining operation at the Kalgold gold mine, 60 kilometers southof Mafikeng in the North West Province of South Africa. Through Kalgold, we also control extensivemineral rights on the Kraaipan Greenstone Belt in the North West Province of South Africa.
57
History: We acquired Kalgold on July 1, 1999 and fully incorporated Kalgold into our operations inOctober 1999. Prior to our acquisition, the Kalgold mine had operated for more than three years.
Geology: The Kalgold operations are situated on the Kraaipan granite-greenstone belt, which is atypical gold-bearing greenstone formation. It has undergone intense structural deformation that hasled to its dislocation into separate units.
Within the mining lease area, mineralization occurs in shallow dipping quartz veins, whichoccur in clusters or swarms, within the steeply dipping magnetite-chert banded iron formation.Disseminated sulphide mineralization, dominated mostly by pyrite, occurs around and between theshallow dipping quartz vein swarms.
The first zone to be exploited by open cast mining has been an area known as the D-Zone. TheD-Zone orebody has a strike length of 1,300 meters. Mineralization has also been found in theMielie Field Zone (adjacent to the D-Zone), the A-Zone and A-Zone West (along the strike to thenorth of the D-Zone), and the Watertank and Watermill areas to the north of the A-Zone.
Mining Operations: The Kalgold operations are engaged in open-pit mining. This operation is subjectto the open cast mining risks detailed in the Risk Factors section. Small subterranean waterintersections in the pit are common and are actively managed and appropriate action is taken whennecessary. The primary mining challenges at the Kalgold operations of achieving optimal volumes andgrades of ore production are addressed by stringent ore reserve management. Water shortages, dueto drought in the area, were experienced for most of fiscal 2007 and the first quarter of fiscal2008, which had a significant impact on production. These water shortages were followed byabnormally high rainfall and electricity disruptions, resulting in a number of days of productionlost during the 2008 fiscal year, which was further compounded by a number of plant breakdowns.Kalgold is on the domestic electricity grid and was subject to extensive load shedding.
In fiscal 2008, the Kalgold operations accounted for approximately 5% (2% in fiscal 2007 and3% in fiscal 2006) of our total gold sales.
Safety: The Kalgold operations had a lost time injury frequency rate of 4.97 per million hoursworked in fiscal 2008, and recorded no fatal accidents in fiscal 2008.
Plants: Ore is trucked from the pit and is directly tipped into the feed bin to the pre-primarycrusher or stockpiled. The ore then undergoes a four phase crushing process before it reaches theDome stockpile. Three ball mills are used to grind the ore down to between 70-80% less than 75micron for the leaching process.
The following table sets forth processing capacity and average tons milled during fiscal 2008 forthe plant:
| | | | | | | | | |
| | | | | | | Average Milled for the |
| | | Processing | | Fiscal Year Ended |
| Plant | | Capacity | | June 30, 2008 |
| | (tons/month) | | (tons/month) |
CIL | | | 135,000 | | | | 127,552 | |
Heap Leach(1) | | | — | | | | — | |
| | |
| (1) | | Active use of heap leaching was discontinued in July 2001. |
In fiscal 2008, the plant at our Kalgold operations recovered approximately 86.89% of the goldcontained in the ore delivered for processing.
Production analysis:
| | | | | | | | | | | | | |
| | | Fiscal Year Ended June 30, |
| Kalgold | | 2008 | | 2007 | | 2006 |
Production | | | | | | | | | | | | |
Tons (‘000) | | | 1,687 | | | | 1,740 | | | | 2,008 | |
Recovered grade (ounces/ton) | | | 0.055 | | | | 0.032 | | | | 0.038 | |
Gold sold (ounces) | | | 93,172 | | | | 56,129 | | | | 77,071 | |
58
| | | | | | | | | | | | | |
| | | Fiscal Year Ended June 30, |
| Kalgold | | 2008 | | 2007 | | 2006 |
Results of operations (millions) ($) | | | | | | | | | | | | |
Product sales ($) | | | 77 | | | | 36 | | | | 39 | |
Cash cost ($) | | | 38 | | | | 27 | | | | 32 | |
Cash profit ($) | | | 39 | | | | 9 | | | | 8 | |
Cash costs | | | | | | | | | | | | |
Per ounce of gold ($) | | | 411 | | | | 485 | | | | 412 | |
Capex ($) | | | 1 | | | | — | | | | — | |
Ounces sold decreased to 56,129 in fiscal 2007, compared with 77,071 in fiscal 2006, due to acombination of lower tons milled as well as a lower recovered grade. Tons milled decreased from2,008,000 in fiscal 2006 to 1,740,000 in fiscal 2007. This decrease was due to lower plantthroughput as a result of water shortages encountered from March 2007. The recovered gradedecreased to 0.032 in fiscal 2007, compared with 0.038 in fiscal 2006. Mining was stopped on the AZone pit during the December 2006 quarter for geotechnical reasons.
Cash costs at Kalgold were U.S.$485 per ounce in fiscal 2007, compared with U.S.$412 per ouncein fiscal 2006. This increase was due to the lower volumes produced.
Tons milled decreased from 1,740,000 in fiscal 2007 to 1,687,000 in fiscal 2008. Ounces soldincreased to 93,172 in fiscal 2008, compared with 56,129 in fiscal 2007, primarily due to thehigher grade mined from the D Zone pit. The recovered grade increased to 0.055 in fiscal 2008,compared with 0.032 in fiscal 2007.
Cash costs increase from U.S.$27 million in fiscal 2007 to U.S.$38 million in 2008 as resultof the write off of the deferred stripping account as mining in the D-zone pit reached completion.In spite of this, cash costs at Kalgold were U.S.$411 per ounce in fiscal 2008, compared withU.S.$485 per ounce in fiscal 2007. The decrease was mainly due to the increase in ounces producedas a result of higher recovered grade.
The processing capacity of the Kalgold operation is 165,000 tons per month. The average tonsmilled in fiscal 2008 were 140,580 tons per month.
Active use of heap leaching was discontinued in July 2001; however, Harmony expects to put thematerial on the heap leach pad through the processing mills at the end of the life of mine torecover the residual gold.
On a simplistic basis, assuming no additional reserves are identified and at expectedproduction levels, it is foreseen that the reported proven and probable ore reserves of 14.3million tons (0.40 million ounces) will be sufficient for the Kalgold operations to maintainproduction until approximately fiscal 2016. However, any future changes to the assumptions uponwhich the reserves are based, as well as any unforeseen events affecting production levels, couldhave a material effect on the expected period of future operations.
Capital Expenditure: We incurred approximately R9.8 million (U.S.$1.3 million) in capitalexpenditures at the Kalgold operations in the fiscal 2008. We have budgeted R8.8 million (U.S.$1.2million) for capital expenditures in fiscal 2009, primarily for exploration drilling and mining ofthe new orebodies.
Phoenix
Introduction: Phoenix is a tailings retreatment operation, located at Virginia and adjacent to ourcurrent and historical mining operations in the Free State province.
History: The project commenced during fiscal 2007 and is aimed at treating the surface sources fromour operations in the Free State province.
Mining operations: Slimes tonnage reclamation steadily increased during fiscal 2008, to an averageof 550,000 tons per month by year end, which is full capacity. The focus during the year was onimproving efficiencies, recoveries and ultimately profitability.
During fiscal 2008, Phoenix accounted for 2% of our total gold sales (less than 1% in fiscal 2006and 2007).
59
Production analysis:
| | | | | | | | | | | | | |
| | | Fiscal Year Ended June 30, |
| Free State (Phoenix) | | 2008 | | 2007 | | 2006 |
Production | | | | | | | | | | | | |
Tons (‘000) | | | 7,033 | | | | 2,368 | | | | 897 | |
Recovered grade (ounces/ton) | | | 0.005 | | | | 0.009 | | | | 0.018 | |
Gold sold (ounces) | | | 32,215 | | | | 21,346 | | | | 15,902 | |
Results of operations (millions) ($) | | | | | | | | | | | | |
Product sales | | | 26 | | | | 14 | | | | 9 | |
Cash cost | | | 12 | | | | 6 | | | | 6 | |
Cash profit | | | 14 | | | | 8 | | | | 3 | |
Cash costs | | | | | | | | | | | | |
Per ounce of gold ($) | | | 381 | | | | 293 | | | | 404 | |
Capex (millions) ($) | | | 5 | | | | 5 | | | | 4 | |
Tons treated from Phoenix were 2,368,000 in fiscal 2007, compared with 897,000 in fiscal 2006,primarily due to Phoenix having been fully commissioned during the year and treating 500,000 tonsper month tailings material. The recovered grade decreased to 0.009 in fiscal 2007, compared with0.018 in fiscal 2006 as a result of an increase in slimes dam reclamation. Ounces sold increased to21,346 in fiscal 2007, compared with 15,902 in fiscal 2006, primarily due to the increase in tonstreated.
Cash costs per ounce decreased during fiscal 2007 to U.S.$293 per ounce, compared withU.S.$404 in fiscal 2006, due to the increase in ounces produced.
Tons treated from Phoenix were 7,033,000 in fiscal 2008, compared with 2,368,000 in fiscal2007. Ounces sold increased to 32,215 in fiscal 2008, compared with 21,346 in fiscal 2007,primarily due to the increase in tons treated. The recovered grade decreased from 0.009 in fiscal2007 to 0.005 in fiscal 2008. The grade of the tons treated is dependent on the time at which theoriginal deposition was done.
Cash costs were U.S.$12 million in fiscal 2008, compared with U.S.$6 million in fiscal 2007,primarily due to the increase in volumes as well as the higher costs of reagents. Cash costs perounce increased during fiscal 2008 to U.S.$381 per ounce, compared with U.S.$293 in fiscal 2007 dueto increase in volume and increase in transport rates and the price of consumables.
Capital Expenditure: We incurred approximately R33.3 million (U.S.$4.6 million) in capitalexpenditures at the Free State operations in fiscal 2008. We have budgeted R14.2 million (U.S.$2million) for Phoenix, primarily for upgrading of major equipment at Central Plant.
Cooke operations
Introduction: The Cooke operations are located in the Gauteng Province of South Africa,approximately thirty kilometers west of Johannesburg. These operations are owned by Randfontein.The operations currently operate under a mining authorization with an area of 7,875 hectares.Production is treated at the Doornkop plant.
During fiscal 2008, an agreement was entered into for the sale of the Cooke operations,together with the associated surface assets. As a result, the assets and related liabilities havebeen classified as held for sale and the results from operations have been included under“Discontinued Operations” in the income statement.
Geology: These operations are situated in the West Rand Goldfield of the Witwatersrand Basin, thestructure of which is dominated by the Witpoortjie and Panvlakte Horst blocks, which aresuperimposed over broad folding associated with the southeast plunging West Rand Syncline. At theCooke operations, two major fault trends are present. The first is parallel to the Panvlakte Faultand strikes north to north-east, having small throws and no lateral shift. The second trend, whichruns north-west to west, has small throws, but significant lateral shift, resulting in thepayshoots becoming displaced.
There are six identified main reef groupings in the area of these operations: the Black Reef;the Ventersdorp Contact Reef; the Elsburg Formations; the Kimberleys; the Livingstone Reefs; andthe South Reef. Within these, several economic reef horizons have been mined at depths belowsurface between 600 and 1,260 meters.
60
The reefs comprise fine to coarse grained pyritic mineralization within well developed thickquartz pebble conglomerates or narrow single pebble lags, which in certain instances are replacedby narrow carbon seams.
Mining Operations: These operations are subject to the underground and waste rock mining risksdetailed in the Risk Factors section. Due to the shallow to moderate depths of the operations,seismicity and pressure related problems are infrequent. There is a risk of subterranean waterand/or gas intersections in some areas of the mines. However, this risk is mitigated by active andcontinuous management and monitoring, which includes the drilling of boreholes in advance of faces.Where water and/or gas are indicated in the drilling, appropriate preventative action is taken.
The Cooke assets and related liabilities were classified as a disposal group and held for saleduring fiscal 2008.
We incurred R53.7 million (U.S.$7.4 million) in capital expenditure in fiscal 2008 at Cooke 3Shaft for accessing the reserves in the 128 South Area to extend the life of mine reserves. Thearea contains an estimated total insitu resource of approximately 4.9 million tons at 5.5 grams perton. It is intended to extract the UE1A reef band which is mainly a conglomerate type reef.
Production at the Cooke operations was negatively affected in fiscal 2008 by a change in the miningmix, with less ore from the high grade VCR reef at Cooke 3 shaft and lower than expected gradesfrom 128 South project at Cooke 3 shaft and from the 90 North 6 area at Cooke 2 shaft. The powershortages during the third quarter in 2008 also impacted negatively on volumes.
During fiscal 2008, the Cooke operations accounted for 12% (10% in 2006 and 2007) of our totalgold sales.
Safety: The safety record at these operations during fiscal 2008 was as follows: in terms of LTFRof 8.98 per million hours worked achieved compared favourably with the group average of 12.83. TheFFR (0.38) at Cooke compared unfavorably with the group average of 0.18.
Safety at the operations receives constant and high-level attention and where problems areidentified steps are taken to address the situation.
Plants: The processing facilities at the operations presently comprises of the Cooke metallurgicalplant, which is serviced by a surface rail network. The Cooke metallurgical plant, commissioned in1977, is a hybrid CIP/CIL plant, which processes the tailings from the surface sands dumps aroundRandfontein.
Feasibility studies are being done for a proposed Uranium Plant of an approximate capacity of500,000 tons per month. It is envisaged that the plant will be completed in approximately threeyears when it will treat uranium ore from the Cooke dumps as well as from the Cooke 3 undergroundoperations.
The following table sets forth processing capacity and average tons milled during fiscal 2008for the Cooke plant:
| | | | | | | | | |
| | | | | Average Milled for the |
| | | Processing | | Fiscal Year Ended |
| Plant | | Capacity | | June 30, 2008 |
| | (tons/month) | | (tons/month) |
Cooke | | | 280,000 | | | | 215,241 | |
In fiscal 2008, the Cooke plant recovery has been approximately 81% of the gold contained inthe ore delivered for processing. During fiscal 2006, the Doornkop plant was upgraded and allunderground tons were moved from Cooke to Doornkop plant. Cooke plant was mothballed in January2006; however, it was re-commissioned during fiscal 2007 to treat surface sources.
Production analysis:
| | | | | | | | | | | | | |
| | | Fiscal Year Ended June 30, |
| Cooke operations | | 2008 | | 2007 | | 2006 |
Production | | | | | | | | | | | | |
Tons (‘000) | | | 3,906 | | | | 2,327 | | | | 2,034 | |
- Underground | | | 1,323 | | | | 1,432 | | | | 1,495 | |
- Surface | | | 2,583 | | | | 895 | | | | 539 | |
61
| | | | | | | | | | | | | |
| | | Fiscal Year Ended June 30, |
| Cooke operations | | 2008 | | 2007 | | 2006 |
Recovered grade (ounces/ton) | | | 0.060 | | | | 0.105 | | | | 0.126 | |
- Underground | | | 0.153 | | | | 0.157 | | | | 0.163 | |
- Surface | | | 0.013 | | | | 0.021 | | | | 0.022 | |
Gold sold (ounces) | | | 236,242 | | | | 243,219 | | | | 256,739 | |
- Underground | | | 201,937 | | | | 224,245 | | | | 245,089 | |
- Surface | | | 34,305 | | | | 18,974 | | | | 11,650 | |
Results of operations (millions) ($) | | | | | | | | | | | | |
Product sales | | | 194 | | | | 154 | | | | 137 | |
Cash cost | | | 123 | | | | 118 | | | | 102 | |
Cash profit | | | 71 | | | | 36 | | | | 35 | |
Cash costs | | | | | | | | | | | | |
Per ounce of gold ($) | | | 517 | | | | 484 | | | | 396 | |
- Underground | | | 516 | | | | 499 | | | | 395 | |
- Surface | | | 520 | | | | 305 | | | | 431 | |
Capex (millions) ($) | | | 22 | | | | 19 | | | | 25 | |
During fiscal 2008, the assets and related liabilities for Cooke 1, 2 and 3 as well as theCooke plant were classified as a disposal group and are held for sale. The results from theoperations were also classified as discontinued operations in the income statement. As a result,the table above and the discussion below include the results of the surface operations.
Tons milled from the Cooke operations were 2,327,000 in fiscal 2007, compared with 2,034,000in fiscal 2006, and ounces sold were 243,219 in fiscal 2007, compared with 256,739 in fiscal 2006.The increase in tons milled was due to the recommissioning of the Cooke Plant to treat surfacesources. The decrease in ounces sold was primarily due to a decrease in the recovery grade for theunderground operations. The decrease in recovery grade at the underground operations from 0.163ounces per ton in fiscal 2006 to 0.157 in fiscal 2007 was due to lower volumes from the high gradeVCR reef at Cooke 3 shaft and lower than expected grades from the 128 South project at Cooke 3shaft and from the 90 North 6 area at Cooke 2 shaft.
Cash costs per ounce of gold were U.S.$484 in fiscal 2007, compared with U.S.$396 in fiscal2006. This increase was attributable primarily to the decrease in grade from the undergroundoperations, as well as an increase in the amount of pillar mining from Cooke 1 at higher cost.Pillar mining is more costly to undertake due to increased support cost and lower mining volumes.Increases in the costs of labor and supplies and the effect of inflation on supply contractsresulted in an increase in cash costs. Electricity increases in excess of current inflation alsonegatively impacted on costs
Tons milled were 3,906,000 in fiscal 2008, compared with 2,327,000 in fiscal 2007, and ouncessold were 236,242 in fiscal 2008, compared with 243,219 in fiscal 2007. The increase in tons milledcan mainly be attributed to the Cooke plant, used for the treating of tailings from sand surfacedumps, coming into full production during fiscal 2008. The plant is treating on average of 215,000tons per month. This was offset by a decrease in tons milled from underground due to the stoppingof Conops, electricity constraints and a reduction in volume from Cooke 1. The decrease in ouncessold was primarily due to lower volumes from underground as a result of the reasons mentionedabove. . The recovery grade from surface decreased from 0.021 in fiscal 2007 to 0.013 in fiscal2008, mainly due to the replacement of higher grade waste rock with lower grade sand from Dump 20.
Cash costs per ounce of gold were U.S.$517 in fiscal 2008, compared with U.S.$484 in fiscal2007. The increase was influenced by decreased efficiency of the machinery in the Trackless areas,increased maintenance cost on those machines, increases in the costs of labor and supplies and theeffect of inflation on supply contracts also negatively affected cash costs.
Capital Expenditure: We incurred approximately R158.8 million (U.S.$21.9 million) in capitalexpenditures at the Cooke operations in fiscal 2008 for ongoing development and other abnormalexpenditure seen as capital.
62
Also included was expenditure for accessing the reserves in the 128 South Area at Cooke 3. We havebudgeted R201.7 million (U.S.$27.8 million) in fiscal 2009, mostly for ongoing development as wellas the upgrade of all Rail Bound Equipment to comply with the legislation and improve safety.
Other — Discontinued operations
Introduction: The results of operation from Other — Discontinued Operations consists of resultsfrom the Orkney operations, Mt Magnet and South Kalgoorlie. Mt Magnet and South Kalgoorlie formpart of our International operations. Refer to “Western Australia” below for a discussion on theiroperations and results.
The discussion on Orkney follows below.
Introduction: We acquired the Orkney operations when on September 22, 2003, we merged with ARMgoldvia a share exchange which resulted in ARMgold becoming our wholly-owned subsidiary. In September2007, we announced that we had entered into formal agreements with Pamodzi for the sale of theOrkney Shafts. The sale was finalized on February 27, 2008 and the related assets and liabilitiesderecognized.
History: Exploration and development at Orkney started from 1886 and following dormant periods,large-scale production commenced during the 1940s with the formation of Vaal Reefs Gold Mining andExploration Company Limited in 1944.
Geology: At the Orkney operations, the Vaal Reef is the most significant reef mined. The reefstrikes northeast, dipping southeast and is heavily faulted to form a series of graben structures.The dip is generally less than 30 degrees but can vary locally in direction and magnitude to exceed45 degrees. The VCR is also exploited, as well as the Elsburg Reef. There are several major faultsin the lease area, being Nooitgedacht, Buffelsdoorn, Witkop, WK2, No 3 BU, No 5 BU and No 2 BUFault. These faults typically have throws of tens of meters and further divide the reef into blocksof up to 100 meters in width.
Mining operations: These operations are subject to all of the underground mining risks detailed inthe Risk Factors section. Mining depths ranged from 1,600 meters to 2,000 meters below the surfaceat the Orkney operations.
During February 2008, the Orkney shafts were sold to Pamodzi. These shafts had been managed byPamodzi since October 2007.
For fiscal years 2008, 2007 and 2006, the Orkney operations accounted for approximately 5% ofour total gold sales.
Safety: For the eight months to February 2008, the safety record at the Orkney operations in termsof LTFR of 19.07 million hours worked compared unfavorably with the group average of 11.55 at thattime. The FFR of nil compared favorably with the group average of 0.14.
Plants: Ore from the Orkney operations was treated at Vaal River Operations’ (“VRO”) No. 1 GoldPlant (of Anglo Gold Ashanti). Various agreements between us and VRO governed the supply andquality of the ore and gold apportionment.
Production analysis:
| | | | | | | | | | | | | |
| | | Fiscal Year Ended June 30, |
| Orkney operations | | 2008(1) | | 2007 | | 2006 |
Production | | | | | | | | | | | | |
Tons (‘000) | | | 571 | | | | 947 | | | | 753 | |
Recovered grade (ounces/ton) | | | 0.100 | | | | 0.126 | | | | 0.171 | |
Gold sold (ounces) | | | 57,132 | | | | 119,109 | | | | 128,774 | |
Results of operations (millions) ($) | | | | | | | | | | | | |
Product sales | | | 40 | | | | 77 | | | | 68 | |
Cash cost | | | 52 | | | | 64 | | | | 59 | |
Cash (loss)/profit | | | (12 | ) | | | 13 | | | | 9 | |
Cash costs | | | | | | | | | | | | |
Per ounce of gold ($) | | | 910 | | | | 543 | | | | 458 | |
Capex (millions) ($) | | | 4 | | | | 15 | | | | 7 | |
63
| | |
| (1) | | The results are for the eight months ended February 2008. |
Tons milled from the Orkney operations were 947,000 in fiscal 2007, compared with 753,000 infiscal 2006. The increase is as a result of the approval of the re-opening of the Orkney 7 shaft.The shaft started producing in the first quarter of fiscal 2007. This was offset by a decrease intons milled due to seismic events resulting in the loss of face length flexibility and volume atOrkney 2.
Ounces sold were 118,984 in fiscal 2007, compared with 128,774 in fiscal 2006. The decrease inounces sold is primarily attributed to lower recovery grade. Recovered grade was 0.126 in fiscal2007, compared with 0.171 in fiscal 2006. The increase is due to the reopening of Orkney 7. Thiswas offset by a change in mining mix at Orkney 4 as a result of seismicity experienced from thehigher grade shaft pillar to lower grade areas. There was also down scaling of production in theshaft pillar area which resulted the mining of more remote areas.
Cash costs were U.S.$65 million in fiscal 2007 compared with U.S.$59 million in fiscal 2006.Cash costs per ounce were U.S.$543 in fiscal 2007 compared with U.S.$458 in fiscal 2006. Thisincrease was attributable primarily due to increases in the costs of labor and supplies and theeffect of inflation on supply contracts.
The Orkney operations were sold to Pamodzi during fiscal 2008 and therefore the results forfiscal 2008 are only for eight months.
Capital Expenditure: We incurred R26.3 million (U.S.$3.6 million) on capital expenditures at theOrkney operations in fiscal 2008.
64
International Mining Operations
Western Australia Operations
We had two operational mines in Western Australia during fiscal 2008, the Mt. Magnetoperations and the South Kalgoorlie operations. These operations were acquired as part of thepurchase of two Australian gold mining companies: New Hampton, acquired in April 2001 and Hill 50acquired in April 2002. The New Hampton transaction included two operations in Western Australia,Big Bell in the Murchison region (which ceased operations in July 2003 and its plant sold inNovember 2003) and Jubilee in the Eastern Goldfields near Kalgoorlie as well as two processingplants associated with these operations and related exploration rights. The Hill 50 transactionincluded the Mt. Magnet operations in the Murchison region, the New Celebration operations in theEastern Goldfields near Kalgoorlie as well as two plants associated with these operations andrelated exploration rights.
Each of our Australian operations conducted surface mining (principally through open-pitmethods) and underground mining, with access through two declines at Mt. Magnet and one decline atSouth Kalgoorlie. The Mt. Marion underground mine at South Kalgoorlie Mine ceased operating in June2007. Open-pit mining at South Kalgoorlie recommenced during fiscal 2007 with the start-up of theShirl and Hampton Boulder Jubilee (“HBJ”) open-pit projects. We used mostly mechanized mining atour Australian operations in comparison to the South African operations (excluding operations atTarget). Contractors conducted much of this mechanized mining. The contractors were responsible forprovision of the equipment and personnel needed for production of the ore under guidance ofmanagement.
We have classified our Western Australian assets as being held for sale as of April 2007 asthey do not fit with our strategy for operating large, long-life mines. These operations also metthe criteria for discontinued operations.
In July 2007, we entered into an agreement with Dioro pursuant to which Dioro acquired ourSouth Kalgoorlie assets. The total purchase price was A$45 million (U.S.$39.8 million), consistingof both a cash and share component. The share component entailed the issuance of 11.4 million Dioroshares (valued at A$20 million (U.S.$17.7 million)), and a cash component of A$25 million(U.S.$22.1 million). The transaction was subject to various conditions precedent, including aminimum capital raising by Dioro of A$35 million (U.S.$30.9 million) by the completion date. OnNovember 30, 2007, all conditions precedent were satisfied, and the transaction was completed andaccounted for on that date. The results of production below therefore reflect only the 5 monthsended November 30, 2007.
Duringfiscal 2008, we entered into an agreement with Monarch Gold for the sale of our MountMagnet operations. However, subsequent to year-end, we were advisedthat Monarch had placed itself in voluntary administration and, onAugust 1, 2008, the Administrator indicated that Monarch will notproceed with the proposed purchase and consequently the purchaseagreement has been terminated. We have since resumed management of the St. Magnet operations which is stillclassified as for sale.
As of June 30, 2008, our Western Australian operations had 2 employees (the care andmaintenance personnel on the Mt. Magnet site).
In fiscal 2008, our Australian operations accounted for approximately 5% of our total goldsales, as compared to 10% in fiscal years 2007 and 2006.
Mt. Magnet Operations
Introduction. In 2002, we acquired Mt. Magnet as part of the Hill 50 transaction. In fiscal 2008,Mt. Magnet’s operations accounted for approximately 4% of our total gold sales, as compared to 6%in fiscal years 2007 and 2006. This change was the result of the site being placed on care andmaintenance as from December 31, 2007.
History: Mining at Mt. Magnet began after the discovery of gold in 1896. From that time to June 30,2008, the Mt. Magnet area has produced approximately 5.8 million ounces. The current Mt. Magnetoperations commenced production in the late 1980s on the Hill 50 and Star underground mines andnearby open-pits, and the processing of low grade ore from previously accumulated stockpiles.Production ceased at the Star underground mine in June 2005. The Star underground mine wassubsequently replaced by St. George, a new underground mine. The Mt. Magnet site was put on careand maintenance as from December 31, 2007 until such time that the site is sold.
65
Geology: The Mt. Magnet operations are located near the town of Mt. Magnet in the Murchison region,560 kilometers northeast of Perth. The geology consists of folded basaltic and komatiiticgreenstones with intercalated banded iron formations and volcaniclastic units. In addition tohaving been intensely folded, the area has undergone substantial faulting and later intrusion byfelsic intrusives. Mineralization within the Murchison belt consists of sulphide replacement style(characteristic of the Hill 50 mine) and quartz lode and shear-hosted hydrothermally emplacedbodies proximal to fault conduits. Smaller stockwork bodies within felsic intrusives are alsocommon. As is typical of the Archaean Shield, the deep weathering profile at Mt. Magnet hasresulted in supergene enrichment and hypogene dispersion of gold in the oxidizing environments.These effects lend themselves well to the process of small scale open-pit mining. Historicallyunderground mining of primary lodes was the largest contributor to Mt. Magnet’s gold production.
Mining Operations:. The Mt. Magnet operations were engaged in underground, open-pit and waste rockmining prior to site closure. These operations are subject to the underground, open-pit, and wasterock mining risks detailed in the Risk Factors section.
Underground operations at Mt. Magnet consisted of the Hill 50 and St. George mines, each ofwhich operates a decline. The Hill 50 mine, which is approaching 1,525 meters in depth, was one ofAustralia’s deepest underground mines. The St. George Mine was approximately 300 meters in depth.Underground mining was conducted by decline tunnel access. The principal challenges confronted bythe Hill 50 underground mine related to its continuing depth and the geotechnical, ventilation andcost impediments that increased depth imposes, including increased ground stress and potentialincreased seismic activity. A decision was made in May 2007 which placed the Hill 50 mine’s declinedevelopment on hold due to significant seismic activity, and effectively put the mine in harvestmode.
With the closure of Star, the development of the new underground mine at the St. Georgeopen-pit provided additional underground tonnage for the Mt. Magnet operations. Undergrounddevelopment at St. George started in December 2005. The first stope was mined in the second quarterof fiscal 2006. Underground mining continued at this mine during fiscal 2007. This mine reached itseconomic depth limit during fiscal 2007, and was put in harvest mode, with mining operationsceasing in October 2007. Open-pit production was hindered by the delay in the start up of the Cueopen-pits until the last quarter of fiscal 2005 as a result of delayed mining approvals andextended contractor negotiations, although these were subsequently resolved and mining commenced infiscal 2006. Open-pit mining mainly took place around Mt. Magnet during fiscal years 2007 and 2008.
Surface operations at Mt. Magnet exploited several medium-sized open-pits, as well as numeroussmaller open-pits. Surface materials from areas previously involved in production, including wasterock dumps and tailings dams, are also processed at Mt. Magnet. The principal challenge faced bythe Mt. Magnet operations involved the short mine lives which result from that the open-pits beingsituated on small orebodies. The Mt. Magnet site was put on care and maintenance as from December31, 2007 until such time that the site is sold.
Plant: The Mt. Magnet operations include one metallurgical plant which was built in 1989 as a CILplant and upgraded in 1999 to a CIP plant. Actual throughputs of the Mt. Magnet plant varies basedupon the blend of oxide and sulphide ores in their feed. Processing capacity is an estimate ofnominal throughput based on a 70% hard (sulphide) and 30% oxide (soft) blend.
The following table sets forth processing capacity and average tons milled during fiscal 2008for the Mt. Magnet plant:
| | | | | | | | | |
| | | | | | | Average Milled for |
| | | | | | | the Year Ended June 30, 2008 |
| Plant | | Processing Capacity | | (for 6 operational months) |
| | (tons/month) | | (tons/month) |
Mt. Magnet | | | 243,000 | | | | 161,000 | |
Throughput rates at Mt. Magnet decreased in fiscal 2008 due to the site being closed and theplant being placed on care and maintenance.
In fiscal 2008, the Mt. Magnet plant recovered approximately 91.9% of the gold contained inthe ore delivered for processing.
66
Production analysis:
| | | | | | | | | | | | | |
| | | Fiscal Year Ended June 30, |
| | | 2008 | | 2007 | | 2006 |
Production | | | | | | | | | | | | |
Tons (‘000) | | | 966 | | | | 1,875 | | | | 1,918 | |
Recovered grade (ounces/ton) | | | 0.080 | | | | 0.073 | | | | 0.078 | |
Gold sold (ounces) | | | 77,097 | | | | 136,428 | | | | 148,822 | |
Results of operations (millions) ($) | | | | | | | | | | | | |
Product sales | | | 56 | | | | 86 | | | | 80 | |
Cash cost | | | 41 | | | | 71 | | | | 59 | |
Cash profit | | | 15 | | | | 15 | | | | 21 | |
Cash costs | | | | | | | | | | | | |
Per ounce of gold ($) | | | 537 | | | | 518 | | | | 399 | |
Capex (millions) ($) | | | 4 | | | | 20 | | | | 24 | |
Tons milled in fiscal 2007 were 1,875,000 compared with 1,918,000 in fiscal 2006, and ouncessold in fiscal 2007 were 136,428, compared with 148,822 in fiscal 2006, mainly as a result ofsignificantly less production from open-pits during the year and a seismic event at Hill 50 in May2007, which also resulted in the reduction in the recovery grade from 0.078 ounces per ton infiscal 2006 to 0.073 ounces per ton in fiscal 2007. Cash costs per ounce were U.S.$518 in fiscal2007 compared to U.S.$399 in fiscal 2006, this increase mainly the result of an increase inunderlying mining costs in Western Australia.
Recovered grade was 0.080 ounces per ton in fiscal 2008 compared to 0.073 ounces per ton infiscal 2007. This was due to higher grades produced from the Hill 50 underground mine. Tons milledwere 966,000 in fiscal 2008 compared to 1,785,000 in fiscal 2007. Ounces sold decreased to 77,097in fiscal 2008, compared to 136,428 in fiscal 2007. The decrease in both tons and ounces in fiscal2008 are a reflection of the Mt. Magnet production figures representing just 6 months of productiondue to the site being placed on care and maintenance.
Cash costs per ounce were U.S.$537 for fiscal 2008, compared to U.S.$518 for fiscal 2007. Thisincrease was due to higher underground and open-pit contracting cost due to the underlying miningcost increases in the Western Australian and a wider Australian mining market environment.
The majority of declared ore reserves were mined during fiscal 2008. The mines were closedand the processing plant has been put on care and maintenance until such time that the site issold.
Capital Expenditure: We spent U.S.$4.3 million in capital expenditure at the Mt. Magnet operationsin fiscal 2008, primarily for underground development and plant components. We have not budgetedfor capital expenditure for fiscal 2009, as we will only undertake critical maintenance inanticipation of the Mt. Magnet site being sold.
Exploration: Activities at Mt. Magnet, Western Australia, were performed to the minimum levelrequired to keep the tenements in good standing as the site and plant is currently on care andmaintenance. We expended A$2.9 million (U.S.$2.7 million) on exploration during fiscal 2008.
South Kalgoorlie Operations
Introduction: The South Kalgoorlie Operations are made up of New Hampton’s Jubilee Operations andHill 50’s New Celebration operations. Since the commencement of operations to November 30, 2007,total gold production from the mines in the South Kalgoorlie area has exceeded 2.5 million ounces.In fiscal 2008, South Kalgoorlie operations accounted for 1% of Harmony’s total gold sales, andaccounted for 4% of our total gold sales in 2007 and 3% in fiscal 2006.
In July 2007, we announced the sale of the South Kalgoorlie Mine to Dioro. The total purchaseprice was A$45 million (U.S.$39.8 million), which consists of a cash component and a sharescomponent. On November 30, 2007, all conditions precedent to the transaction were satisfied. Theresults for fiscal 2008 below reflect only the 5 months ended November 30, 2007.
History: The South Kalgoorlie operations included several open-pits at Jubilee and New Celebration,as well at the Mt. Marion underground
67
mine. The Jubilee operations were originally comprised of thelarge Jubilee open-pit and a number of smaller open-pits. The New Celebration operations were initially developed in1987 by Newmont exploiting the same ore body that hosted the Jubilee Pit. Hill 50 acquired theseoperations from Newcrest Mining Ltd. in June 2001. The Mt. Marion decline was established in 1998.Open-pit mining ceased at the South Kalgoorlie Operations at the end of fiscal 2005, with only lowgrade stockpiles treated during fiscal 2006 together with Mt. Marion ore. During fiscal years 2008and 2007, open-pit mining recommenced at South Kalgoorlie Mines, with a cutback on the HBJ pit, aswell as the Shirl open-pit.
Geology: The South Kalgoorlie mines were located approximately 30 kilometers south of Kalgoorlie inthe Eastern Goldfields region of Western Australia. The South Kalgoorlie orebodies were located ina number of geological domains including the Kalgoorlie-Kambalda belt, the Boulder-LefroyStructure, the Zuleika Shear, the Coolgardie Belt and Yilgarn-Roe Structures. At South Kalgoorlie,the mining tenure and geology straddled the three major fault systems or crystal sutures consideredto be the main ore body plumbing systems of the Kalgoorlie Goldfield. The geology consisted ofArchaean greenstone stratigraphy of basalts and komatiites with intercalated sediments, tuffs,volcaniclastics and later felsic intrusives. Late stage and large scale granitic (Proterozoic)intrusion stoped out large sections of the greenstone. Quartz filled lode and shear-hosted bodiesare the most dominant among many mineralization styles. Large scale stockwork bodies hosted infelsic volcanics were an important contributor to bulk tonnage of relatively low grade deposits.
Mining Operations: The South Kalgoorlie operations are engaged in open-pit, underground and wasterock mining. These operations are subject to the underground, open pit and waste rock mining risksdetailed in the Risk Factors section.
At the South Kalgoorlie operations during fiscal 2008, open cast mining took place at Shirlopen-pit, together with a cutback project on the HBJ open-pit. The HBJ open-pit will have a minelife of three years and consist of 3.3 million tons of 0.048 ounces per ton. The Shirl and HBJopen-pit feedstock as well as low grade stockpiles were processed during the year. The discovery ofthe Shirl prospect during fiscal 2006, which resulted in an open-pit reserve of 50,000 ounces and a15 month mine life, together with an improved gold price environment, lead to the recommencement ofopen-pit mining at South Kalgoorlie mines during fiscal years 2008 and 2007. The primary challengethat faced the South Kalgoorlie operations involved identifying adequate sources of new open-pitand underground reserves and managing the geotechnical risk on the HBJ pit cutback. See “RiskFactors — Risks Relating to Our Business and Our Industry — To maintain gold production beyondthe expected lives of Harmony’s existing mines or to increase production materially above projectedlevels, Harmony will need to access additional reserves through development or discovery.”
Plant:. The South Kalgoorlie operation had a metallurgical plant located at Jubilee. This CILtreatment plant was capable of treating the planned production from the mining operations. Ore washauled from the open-pits and from low grade Shirl stockpiles to the treatment plant byconventional road trains. Actual throughputs of the Jubilee plant varied based upon the blend ofoxide and sulphide ores in their feed. Processing capacity was an estimate of nominal throughputbased on a 70% hard (sulphide) and 30% soft (oxide) blend.
The New Celebration plant was sold during fiscal 2006 for A$3.0 million. This plant wasoriginally commissioned in 1986 as a CIP plant and later upgraded in 1988 by the addition of alarger parallel circuit.
The following table sets forth processing capacity and average tons milled during fiscal 2008,prior to the completion of the sale of the South Kalgoorlie plant:
| | | | | | | | | |
| | | | | | | Average Milled for |
| | | | | | | the Year Ended June |
| Plant | | Processing Capacity | | 30, 2008 |
| | (tons/month) | | (tons/month) |
Jubilee | | | 122,000 | | | | 95,400 | |
Throughput rates in fiscal 2008 were lower than capacity due to tank refurbishments at theJubilee plant.
In fiscal 2008, the Jubilee plant recovered approximately 82.4% of the gold contained in theore delivered for processing compared to 89% in 2007.
68
Production analysis:
| | | | | | | | | | | | | |
| | | Fiscal Year Ended June 30, |
| | | 2008(1) | | 2007 | | 2006 |
Production | | | | | | | | | | | | |
Tons (‘000) | | | 477 | | | | 1,391 | | | | 1,480 | |
Recovered grade (ounces/ton) | | | 0.058 | | | | 0.064 | | | | 0.056 | |
Gold sold (ounces) | | | 27,778 | | | | 88,371 | | | | 82,639 | |
Results of operations (millions) ($) | | | | | | | | | | | | |
Product sales | | | 19 | | | | 56 | | | | 42 | |
Cash cost | | | 14 | | | | 45 | | | | 38 | |
Cash profit | | | 5 | | | | 11 | | | | 4 | |
Cash costs | | | | | | | | | | | | |
Per ounce of gold($) | | | 517 | | | | 504 | | | | 454 | |
Capex (millions)($) | | | 12 | | | | 7 | | | | 4 | |
| | |
| (1) | | The results are for the five months ended November 2007. |
Tons milled in fiscal 2007 were 1,391,000, compared to 1,480,000 in fiscal 2006, while ouncesrecovered in fiscal 2007 were 88,371 as compared to 82,639 in fiscal 2006. This increase in ouncescompared with the decrease in milled tons in fiscal 2007 were primarily attributable to theincreases in the recovery grade from 0.056 ounces per ton from fiscal 2006 to 0.064 ounces per tonin fiscal 2007. The increase in the recovery grade resulted from the mining of predominantlyhigher-grade underground ore. The decrease in throughput in fiscal 2007 from 2006 was due largelyto tank refurbishments at the Jubilee plane.
Cash costs per ounce were U.S.$504 for fiscal 2007, compared to U.S.$454 for fiscal 2006. Thisincrease was due to higher underground and open-pit contracting costs due to the continuingincrease in the underlying Western Australian mining environment and higher gold production levels.
Tons milled in fiscal 2008 were 477,000 compared with 1,391,000 in fiscal 2007, and ouncessold in fiscal 2008 were 27,778 compared with 88,371 in fiscal 2007. This decrease in ounces, andincrease in tons, was primarily attributable to the sale of the South Kalgoorlie operations toDioro on November 30, 2007.
Cash costs per ounce were U.S.$517 for fiscal 2008, compared to U.S.$504 for fiscal 2007.This increase was due to the higher underground and open-pit contracting costs due to theunderlying market increase in the Australian mining environment and lower gold production levels.Recovered grade was 0.058 ounces per ton in fiscal 2008, compared to 0.064 ounces per ton in fiscal2007. This decrease in ounces and tons was primarily attributable to a number of factors, namelythe open pit throughout for the year being replaced by low grade stockpiles (which also caused thereduction in grade) and the sale of the operations to Dioro.
Capital Expenditure: In fiscal 2008, we spent U.S.$12 million in capital expenditures at SouthKalgoorlie, primarily for the Shirl open-pit and plant refurbishments. Due to the sale of the SouthKalgoorlie operations, we have not budgeted for capital expenditures for fiscal 2009.
Exploration: Exploration activities were scaled back in the first half of fiscal 2008 inanticipation of the sale of the South Kalgoorlie operations, with A$1 million expended.
PNG Operations
Overview
Introduction: As at the end of fiscal 2008, our lease holding in PNG is located southwest of Laein the Morobe Province and encompasses over 3,480 square kilometers of tenure. The tenements areoutlined in the figure below and fall into three main blocks centered in the Morobe province. Theseinclude the Wafi leases (440 square kilometers), the Morobe — Hidden Valley leases (971 squarekilometers) and the Morobe Coast EL (2,069 square kilometers).
Harmony PNG tenement locations. In terms of regional geological setting, the tenements cover aportion of the PNG mobile belt. The mobile belt comprises tract of metamorphosed Lower Jurassic andCretaceous sediments and oceanic crust. These rocks have undergone deformation
69
in the collisionzone between the Australian and Pacific Plates and multiple intrusive events including Tertiary granodiorite and youngermineralized porphyries. The PNG mobile belt hosts a number of major gold and copper-gold depositsincluding the Wafi-Golpu and Hidden Valley Projects which are 100% owned by us.
Exploration expenditure outlook for fiscal 2009 is currently estimated at A$19.6 million. Resultsfrom this work have been highly encouraging, as a number of targets with the potential for majorstand-alone gold and copper/gold deposits have been identified and advanced to the drill testingphase.
We currently have offices in Lae, Wau and at the Hidden Valley site, to facilitate thedevelopment of the Hidden Valley project and support both the exploration efforts in the region andthe pre-feasibility work on the Wafi Golpu copper gold project. In 2006 a technical support officewas opened in Brisbane to support the construction phase of the Hidden Valley project as well asthe evaluation of the Wafi and Golpu prospects.
We completed stand alone PFS in Golpu during the June 2007 quarter and in Wafi during theDecember 2007 quarter, which included the Wafi gold resources and examined the development of threeproduction scenarios:
| | • | | Golpu stand alone (an update of the Golpu PFS scenario); |
| |
| | • | | Golpu + Link Zone; and |
| |
| | • | | Golpu + Link Zone + NRG1; |
The PFS reports were subject to Gate Reviews and a CPR. Neither the Gate Reviews nor the CPRidentified any fatal flaws in the PFS reports. However, a number of outstanding issues wereidentified. The returns projected by the studies did not meet our requirements, and it was decidedthen not to immediately proceed to the feasibility stage. Further studies are planned for fiscal2009 to address outstanding issues and to investigate alternative production scenarios which mayimprove projected returns.
Hidden Valley Project
Introduction: The Hidden Valley project entails the construction of a significant gold and silvermine. This mine will process 4.6Mt of ore a year from the two open-pits. The Hamata orebody is onesmall pit and the Hidden Valley and Kaveroi orebodies are in a much larger open-pit. The mine islocated in a highly prospective exploration lease area and it is envisaged that, as activeexploration continues, the life of the process facility may be extended as it is fed from a numberof sources. We own the Hidden Valley Project through our wholly-owned PNG subsidiary, MorobeConsolidated Goldfields Ltd. Subsequent to the year ended 2008, our interest in the Hidden Valleyproject and other PNG assets and tenements were reduced to 69.99% due to Newcrest Mining Limited(“Newcrest”) acquiring interests in the PNG assets. See “Recent Developments”.
The project comprises four exploration licenses of 966 square kilometers in the Wau Districtof Morobe Province, PNG and is located 210 kilometers north-northwest of Port Moresby and 90kilometers south-southwest of Lae, the two largest cities in PNG. Access to the project ispresently by sealed road from the deepwater port of Lae to Bulolo. We have constructed anall-weather gravel road from Bulolo to the Hidden Valley mine site to access the site.
History: Alluvial gold was first discovered at Hidden Valley in 1928 but it was not until the early1980’s that the area was investigated by CRA Exploration using modern exploration techniques thatresulted in the discovery of the Hidden Valley and Kaveroi gold deposits on EL 677. A number offeasibility studies have been prepared for the Hidden Valley Project by the various owners,including one by Abelle in 2003. We have extensively reviewed and updated the Abelle feasibilitystudy during fiscal 2006 in order to: (a) reflect changes in the project’s ore body interpretation;(b) incorporate increases in capital and operating costs as a result of energy prices and scarceresources in the mining industry as well; and (c) resolve technical aspects that were outstandingfrom the previous study. The updated feasibility study was presented to the Board during June 2006and they approved construction of the project. In late 2007, we began a search for a partner topartake in all of our PNG mining and exploration activities. Following a selection process, weselected Newcrest to buy into our PNG activities and to form a joint venture with us. Newcrest’sholdings in the PNG assets and tenements is expected to increase to 50% up to a maximum of U.S.$306million by the middle of calendar year 2009.
Site Access. The Hidden Valley site is located approximately 90 kilometers south-southwest ofLae, which is the nearest deepwater port for the project, and the Capital of Morobe Province.Access to the site from Lae uses an existing 110 kilometers sealed two-lane main road to the townof Bulolo, continuing to Hidden Valley via an all-weather two-lane access road constructed by us.Work commenced on the construction of the Hidden Valley access road to the site from Bulolo town inOctober 2005. The road reached the mining lease boundary in May 2006 and the in-filled road networkhas been extended to the Hidden Valley deposit, Pihema Creek and the Hamata plant site. PihemaCreek has been
70
divertedand platforms have been established for most of the project infrastructure, such as the permanent camp and the administration building. Work has commenced onthe Tailings Storage Facility and the Hamata plant site. We contracted a road construction managerand a core of operators with extensive PNG road-building experience to undertake this part of theproject, utilizing equipment we bought for construction purposes.
Engineering Procurement and Construction Management Contract. Following Board approval, asmall owners team of experienced construction professionals was recruited, including several keyindividuals with extensive PNG experience, to ensure that project objectives, scope of work and allother project requirements are met. In July 2006 an agreement was reached with the engineeringgroup Ausenco Limited to provide engineering procurement and construction management services forthe project. Ausenco started immediately with the preparation of a project execution plan as wellas the detailed design stage of the project which is set for completion at the end of December2007. At the end of fiscal 2008, the detailed design was approximately 90% complete and 100 out of110 planned procurement/contract packages have been put out to enquiry. To date, 100 packages havebeen awarded.
Power supply. The ability to obtain an alternate power supply from PNG’s national powersupplier, PNG Power Limited (“PPL”), is of critical importance to the economics of the project. OnMay 14, 2007, we announced that we had signed an agreement with PPL to supply the Hidden Valleymine with electricity. PPL has committed to construct new transmission lines and infrastructure inorder to supply hydro-electricity from the Yonki Dam. Contracts for this work have already beenawarded, and supply is expected to commence by the middle of calendar 2010.
In addition, we acquired diesel generators and will install them for the purpose of providing100% backup power supply to the project, if required, and will be powering the site untilhydro-electricity is supplied.
Customs and Excise. In November 2006 the PNG National Executive Committee approved exemptionsto customs and excise on a range of commodities that will be required for the construction of theproject. This was gazetted, and customs officials at Lae port are already applying the exemptions,based on the draft gazettal notice.
Mining Fleet. The mining equipment required for the project consists of: four 180t excavators,a fleet of nine 175t haul trucks and a range of ancillary equipment. Supply and maintenanceagreements for this fleet were signed in September 2006. The delivery of the first batch of miningequipment for pre-stripping took place in the second quarter of fiscal 2007 and the delivery of theremainder of the fleet was taken during fiscal 2008.
Geology: The proven and probable gold reserves for the Hidden Valley/Kaveroi/Hamata deposits are2.02 million ounces at 0.062 ounces per ton. Silver proven and probable reserves at HiddenValley/Kaveroi and Hamata amount to 30.71 million ounces at 1.093 ounces per ton. Extensivedrilling is currently being undertaken at the Kaveroi prospect adjacent to the Hidden Valley orebody, with the intention to add additional reserves to the project.
Environment. The Environment Management Plan, which is a requirement of the mining lease, hasbeen approved by the PNG Department of Environment. The key environmental issue for the project isthe effective management of water quality in the Bulolo and Watut rivers. A range of controlmeasures will be implemented for acid rock drainage, sediment runoff and tailings facilitydischarge water quality. Work continues on baseline studies and monitoring programs required forboth the construction and operational phases of the project. Re-engineered surface designs have ledto the tailings storage facility capacity being increased to 46.3 million tons and the waste dump’sdesign now complying with acid rock drainage and other environmental commitments.
Community affairs/landowner discussions. Community support and development of the mine incompliance with the memorandum of agreement with landowner groups is critical to the success of theproject. Meetings are held regularly with these groups and officials from the provincial andnational government to monitor progress and ensure these objectives are met. A range ofopportunities for the commercial participation of landowner groups in the development of theproject are being considered as a priority, and community relations initiatives focused on positiveoutcomes for health, education and infrastructure are ongoing.
Project Overview: Once fully developed, the Hidden Valley Mine is expected to process 4.6 milliontons of ore per annum from ore mined at two open-pits, the Hamata ore body in one small pit and theHidden Valley and Kaveroi orebodies in a much larger pit. Expected annual production will be250,000 ounces of gold per annum, with a peak production of 275,000 ounces, and 4 million ounces ofsilver. Expected mine life is 14 years. The construction period is estimated to be 30 months, withthe mine expected to be commissioned by March 2009.
The resources will be mined in a sequence that sees the low silver, high gold Hamata ore minedfirst, with plant and infrastructure
71
development for the project developed in close proximity tothe Hamata deposit. The next ore mined will be the Hidden Valley/Kaveroi oxide/transition ores (high silver) followed bythe Hidden Valley/Kaveroi primary ores.
Plant: As part of the project a treatment plant was brought from Misima Mines Limited andtransported to Lae in April 2005. Parts of the plant that will be utilized in the project have beenidentified and refurbished in fiscal 2007 with the remainder to be disposed of. The plant is storedin Lae and its components will be transported to Hidden Valley for installation as the projectproceeds.
Once completed, the processing plant is expected to process ore at a rate of approximately 4.6million tons per annum and has been designed with three distinct process routes that complement themetallurgical characteristics of the three ore types to be mined. The processing plant willcommence as a primary crushing, grinding (with the incorporation of a gravity gold recoverycircuit), CIL, Merrill-Crowe zinc precipitation, goldroom and tailings detox plant for the lowsilver Hamata ores, revert to a primary and secondary crushing, grinding, flotation, concentrateregrind, counter-current decantation circuit with Merrill-Crowe zinc precipitation, flotationconcentrate and tailing CIL, goldroom and tailings detox for the high silver oxide/transition oresand then a similar circuit without flotation tail CIL for high silver sulphide ores from Hiddenvalley/Kaveroi ores. The gravity gold recovered will be processed through an intensive cyanideleach followed by electrowinning circuit to produce a high quality ore product.
Ore will be delivered by truck to the Hamata and Hidden Valley crusher stations. CrushedHamata ore will be delivered by conventional conveyor to the primary stockpile and Hidden Valleyore will be delivered via an overland pipe conveyor to the same stockpile.
All tailings will be stored in a tailings storage facility, and all water recovered will besubject to detoxification prior to being re-cycled or released to the environment. The processingplant and tailings storage facility will be built to meet or exceed the requirement of theInternational Cyanide Management Code. Construction completion is planned for the second quarter offiscal 2009 with initial gold production anticipated by middle of calendar 2009.
Government royalty and other rights. The gold and silver production from the Hidden ValleyProject will be subject to a 2% royalty, payable on the net return from refined production ifrefined in PNG or 2% royalty on the realized price if refined out of PNG.
The government of PNG also has a statutory right to acquire up to a 30% participatory interestin mining development projects, at sunk cost. However the memorandum of agreement signed betweenthe government and ourselves reduced the participation right to 5%, should the government wish toexercise it. Once an interest is acquired by the government of PNG, it contributes to the furtherexploration and development costs on a pro rata basis.
Third Party Royalties. On March 28, 2007, we announced that we had concluded negotiations withRio Tinto pursuant to which we would purchase the Rio Tinto rights under a royalty agreementrelating to Hidden Valley, which was entered into prior to our acquisition of the Hidden Valley andKerimenge deposits in PNG. Under the royalty agreement, Rio Tinto had the right to receive aportion of between 2% and 3.5% of future ounces produced by the Hidden Valley mine in PNG. Theconsideration we paid to Rio Tinto totaled U.S.$22.5 million, which was settled with our issue ofordinary shares valuing U.S.$20 million, with the balance of U.S.$2.5 million paid in cash.
The transaction will reduce the cash costs per ounce of gold produced at Hidden Valley, andall further extensions to the project, mine life and reserves will be free of this royalty.
Capital Expenditure: Capital expenditure on the project for fiscal 2008 was U.S.$162 million (A$181million) compared to the U.S.$71 million (A$90 million) spent in fiscal 2007. Capital was mainlyspent on completing earthworks within the mining lease, particularly the process plant platform,construction of the Hamata permanent camp and related infrastructure. Other areas of significantexpenditure were for process equipment and management related costs.
The total project capital cost is estimated to be U.S.$579 million (A$605 million), whichrepresents a 27% increase in A$ terms on the last reported budget. Increases in costs wereprimarily caused by market forces resulting from the high demand created by resource developmentprojects in the region. There were no significant changes in the scope of work of the project.This value excludes U.S.$37 million for mine fleet repayments post the construction phase as wellas U.S.$22.5 million for the Rio Tinto royalty buy-out which is not considered part of theconstruction capital.
72
Morobe Consolidated Goldfields Limited (MCG) Tenements
The MCG tenements comprises some 2,157 square kilometers of tenure and include the HiddenValley Mining lease (ML151), four granted Exploration licenses (EL497, EL677, EL1193 and EL1403)and three Exploration Licenses (EL1629, EL1630 and EL1631). The tenement boundaries are outlinedbelow in figure 1.
The tenements are under-explored and remain highly prospective for large-scale porphyry Cu-Audeposits, low-grade bulk mineable epithermal Au-Ag deposits (similar to Hidden Valley) and forhigh-grade epithermal Au satellite resources. Focus of the exploration program on the MorobeConsolidated tenements is three-fold:
| | • | | Major new stand alone discoveries; |
| |
| | • | | High-grade drivers to improve cash flows of the Hidden Valley Project; and |
| |
| | • | | Additional reserves to substantially increase mine life of the Hidden Valley Project. |
Exploration programs undertaken during fiscal 2008 included those on the Hidden Valley MiningLease, the area surrounding the Kerimenge Prospect, and on the Morobe Coast EL1403. However, inaddition to these areas, project generation continued, such as the capturing of historical data andgrassroots exploration activities (which include mapping, stream sediment sampling and integrationof results with regional magnetic data).
Hidden Valley ML
Introduction: Minimal drilling occurs outside of the deposit areas at Hidden Valley. Projectgeneration work which comprised ridge and spur soil sampling (2,824 samples), mapping (over 25 linekilometers) and sampling new road cuttings (7,675 samples) were completed during fiscal 2008. Workintegrating the geological and geochemical datasets together with detailed helimagnetics is inprogress, and will provide a new solid geology interpretation to identify additional targets on theHidden Valley Mining Lease.
Project Status: Continuous channel sampling on new trenches has resulted in some major interceptsof high grade gold mineralization at the Upper Bulolo prospect, located approximately 1 km east ofthe Hidden Valley open-pit. Trenching work designed to scope out the extent of surfacemineralization continues and, due to high grades, first pass drilling at this prospect will be apriority in fiscal 2009.
Kerimenge and the broader prospect potential
Introduction: The Kerimenge deposit lies approximately 7 kilometers east of the proposed HamataProcessing Plant site. Work completed during fiscal 2008 was focused on trenching andreconnaissance away from the deposit area to outline mineralization controls. Some 2,036 sampleswere collected and assayed from over 4 line kilometers of hand-dug trenches.
Project Status: Results from the trenching work have identified 2 drill targets for follow-up workin fiscal 2009. If successful, this drilling should also increase understanding of the mainmineralization controls of this highly prospective project. Compilation work has also highlightedthe Kauri Prospect (located approximately 1 kilometer north of the Kerimenge deposit) as havingpotential for a major stand-alone Au deposit similar to that of Hidden Valley. Certain follow-upsin this area are planned for the third quarter of fiscal 2009.
73
Figure 1: Tenement Location Map
Morobe Coast Exploration License
Introduction: The Morobe Coast exploration license, EL1403, encompasses some 1,041 squarekilometers of tenure. A compulsory 50% reduction was completed in April 2008. The area lies to thesoutheast of the Morobe Goldfield, and we believe it presents grassroots exploration potential.Historical exploration work has been limited, but returned anomalous gold assays in rock chip andstream sediment samples from the Lokaniu volcanics.
Giu Prospect. The Giu prospect falls approximately 10 kilometers southwest of the Morobe townshipon the east coast of PNG, and has been the main focus of exploration activities on EL1403. Theprospect represents a district scale anomaly, 20 kilometers in diameter with elevated gold rockchip and stream sediment geochemistry. The aim of the work programs is to identify and developprospect areas with the potential for stand-alone-gold (+/- related metal) orebodies.
Mapping to date has outlined several areas of structurally controlled epithermal veinmineralization, hosted in vesicular basalts. Rock chip results have been encouraging with anomalousvalues of copper, gold, molybdenum and zinc returned.
Project Status: Some 400 stream sediment and rock chip samples were collected during fiscal 2008,and several highly anomalous drainages have been identified. Field work in the form of ridge andspur soil sampling is scheduled for fiscal 2009 in order to trace the anomaly to its bedrocksource. Airborne magnetics are also planned for fiscal 2009 to provide additional base data forintegration with surface geochemical results and assist with drill targeting.
Wafi Golpu Project Area
Introduction: The Wafi prospect is owned through Wafi Mining Limited, our wholly-owned subsidiary.The first exploration at Wafi dates back to the nationwide porphyry copper search by CRAExploration Ltd in the late 1960’s. Elders Resources farmed-in to the project from 1989-1991, andAGF subsequently farmed-in to the project for a short period in 1997 prior to going intoadministration in 1998. Aurora subsequently acquired the project from Rio Tinto (CRA) in 1999, withownership passing to Abelle when it merged with Aurora in 2002. We assumed control of the WafiProject by way of its acquisition of Abelle in 2003.
74
The project is held under 4 contiguous exploration licenses (EL 440, EL 1316, EL 1103 and EL 1105),totaling 440.6 square kilometers. A further 688.7 square kilometers of tenure has been applied forin 2 separate exploration license applications, namely ELA 590 and ELA 1612. Tenements are outlinedabove in figure 1. The Wafi Golpu Project comprises 2 separate ore systems located within closeproximity of each other known as the Wafi Gold Project and the Golpu Copper/Gold Project,respectively. The Wafi gold mineralization is hosted by sedimentary/volcanoclastic rocks of theOwen Stanley Formation which surrounds the intrusive Wafi Diatreme. Gold mineralization occurs inthe form of extensive high-sulphidation epithermal alteration overprinting porphyry mineralizationand epithermal style vein-hosted and replacement gold mineralization with associated wall-rockalteration. Exploration expenditure (including Pre-feasibility studies) on the project for fiscal2008 was U.S.$13.2 million (K38 million).
Geography: The Wafi prospect is located near Mt. Watut in the Morobe Province of PNG, approximately60 kilometers southwest of Lae and about 60 kilometers northwest of Wau. The Wafi camp is locatedat an elevation of approximately 400 meters above sea level in terrain that is mountainous andforested in most areas. The site is accessed by sealed road (Lae to Bulolo) which comes within 5kilometers of the eastern edge of the tenements and 15 kilometers from the Wafi camp. From thesealed road, a 38 kilometer dirt-base access track to the prospect is accessible during dry weatherconditions. The site is serviced by helicopter when the road access is cut due to wet weather.Watut Valley is located immediately west of the project, and the foothills of Watut Valley areplanned to be utilized for placement of ore processing and mine infrastructure.
Mining Reserves. Following completion of the Golpu Copper/Gold pre-feasibility study, a probableore reserve has been declared. See Item 4. “Reserves”.
The Golpu Ore Reserve is derived from the Golpu Stand Alone Project Pre Feasibility Study.This study assumes a block cave underground mine with ore processed on site to produced a copperand gold concentrate for shipping to smelter. Metallurgical Studies indicate that recoveries of 88%for copper, 54% for gold and 36% for molybdenum can be expected. Metal prices are assumed atU.S.$2.30/lb for copper, U.S.$520/oz gold and U.S.$20/lb for molybdenum.
In declaring the probable reserve, the following considerations are required:
| | 1. | | The PFS is completed to industry accepted standards for a PFS (±20-25% accuracy). The outcome offurther more detailed studies may affect the reserve. |
| |
| | 2. | | The location for the tailings storage facility has not been finalized, however two potential sitesproximal to the project have been defined. |
| |
| | 3. | | There are outstanding issues associated with traditional land owners required to be resolved beforethe project is able to be constructed. |
| |
| | 4. | | The Board has not yet committed to completing subsequent phases of study, or to project construction. |
A reserve for the Wafi gold ore bodies has not been declared.
Government Royalty and Other Rights. The metal production from the Wafi Project is subject to a 2%royalty payable on the net return from refined production if refined in PNG or a 2% royalty payableon the realized price if refined outside of PNG. The government royalty has been accounted for inproject financial models. PNG also has a statutory right to acquire up to a 30% participatoryinterest in mining development projects at sunk cost. Once an interest is acquired by thegovernment of PNG, it contributes to the further exploration and development costs on a pro ratabasis.
Third Party Royalties. Pursuant to the sale agreement of Wafi Mining Ltd to Abelle (via whollyowned subsidiary companies) from Rio Tinto, a royalty of 2% on gold production or a 2% NSR (netsmelter return) from copper-gold concentrates is payable to Rio Tinto as a deferred acquisitioncost. The royalty has been accounted for in project financial models.
Capital Expenditures: No capital expenditures were incurred during fiscal 2008 as thepre-feasibility study was still underway, and costs were expensed as a result.
Pre-Feasibility Studies: Two pre-feasibility studies for the Wafi Golpu project have beencompleted in the past year:
The Golpu stand alone Pre-Feasibility Study (“Golpu PFS”), dated July 2007, whichexamined solely the development of Golpu copper gold resources;
The Wafi Pre-Feasibility Study (“Wafi PFS”), dated October 2007, which includedthe Wafi gold resources and examined the development of the following threeproduct scenarios:
75
| | • | | Golpu stand alone (an update of the Golpu PFS scenario); |
| |
| | • | | Golpu + Link Zone; and |
| |
| | • | | Golpu + Link Zone + NRG1; |
The PFS reports were subject to Gate Reviews and a Competent Persons Report. Neither the GateReviews nor the CPR identified any fatal flaws in the PFS reports but a number of outstandingissues were identified. The returns projected by the studies did not meet our requirements and itwas decided not to immediately move to Feasibility stage. Further studies are planned for thefiscal 2009 to address outstanding issues and investigate alternative production scenarios whichmay improve projected returns.
Wafi Gold Projects
Introduction: The Wafi Gold resource is comprised of three main zones: Zone A, Zone B and the LinkZone (high grade lenses within Zone B). In addition to the Wafi resource, the Western Zone is anadvanced exploration project.
Geology: The pre-feasibility study we undertook focused on extraction of the high grade Link Zonematerial, and on delineation of shallower oxidized mineralization, amenable to high gold recoveryunder standard cyanide leach conditions (associated with Zones A and B). Additional explorationactivities have focused on the discovery of additional Link Zone style mineralization (such as theWestern Zone) which may have the potential to improve Wafi gold project economics.
Metallurgical test work for the Link Zone has focused on comminution test work and whole orepressure oxidation that has demonstrated the technical viability of the processing method, withgold recoveries of approximately 95% achieved. The Wafi PFS showed the Link Zone not to be aneconomic scenario based on estimated costs and the assumed gold price.
Metallurgical test work for the Non-Refractory gold ore (“NRG1”) focused on the establishmentof cyanide recoveries in both the transitional and fully oxidized ores across the knownmineralization. Test work has shown that the 95% recovery of gold in completely oxidized ores wasconsistently achieved. Recovery in the transitional material remains variable with indicationsthat recoveries averaging 84% to 86% are able to be achieved. The Wafi PFS showed the NRG1 resourcenot to be an economic scenario based on estimated costs and the assumed gold price.
Project Status: Geotechnical, mining, infrastructure, and environmental investigations wereundertaken as part of the Link Zone and NRG1 study, in parallel with the Golpu studies. Synergiesbetween the Wafi Gold projects and the Golpu Copper project were utilized during the studies tominimize cost as far as possible. Despite these synergies the gold resources were not determined tobe economic. Further work to expand gold resources and examine development alternatives are plannedfor the coming year.
Golpu Copper-Gold Project
Introduction: The Golpu Copper-Gold Project, or Golpu Project, is located approximately onekilometer northeast of the Wafi gold orebodies.
Geology: The Golpu host lithology is a typical zoned porphyry copper alteration halo, grading frompotassic to phyllic to advanced argillic upwards in the core. Outwards from the core, thealteration grades from the above to argillic potassic, to propylitic. The mineralized body is aporphyry copper-gold ‘pipe’ with approximately 200 meters by 200 meters plan dimensions, slightlynorth plunging and still displaying strong mineralization at grades similar to those in the rest ofthe potassic alteration zone at 1.2 kilometers depth (the maximum depth to which it has beendrilled). Recent drilling and reinterpretation have shown that copper and gold mineralizationextend some way into the metasediment host rock immediately adjacent to the porphyry body. Themineralized metasediment has potential to add up to 75% to the volume of the porphyry stock ifadditional exploration defines the mineralization as part of the resource.
The surface expression is oxidized and leached to about 150 meters vertical depth, resultingin a residual gold only mineralization from which the copper has been leached. At the oxidationinterface, a strong 20- to 30 meters thick zone of supergene copper enrichment is developed whichtransitions at depth into a lower grade covellite-enargite ore. Beneath this is a zone of morecovellite rich mineralization that contains lesser enargite and consequently less arsenic. Fromapproximately 300 meters below surface, the ore exists in a covellite-rich (arsenic-poor) formgrading into a chalcopyrite-bornite rich zone from approximately 500 meters to its currentknown depth of approximately 1.2 kilometers. We completed the pre-feasibility study for Golpuduring the last quarter of fiscal 2007. The PFS identified a reserve of 78.5Mt at
76
1.1% Cu, 0.6g/tgold and 121 ppm Molybdenum. There is potential to significantly increase the mining inventory ifadditional mineralized metasediment material is able to be included in the resource estimatefollowing further exploration activities.
The metasediment domain comprises mineralization peripheral to the porphyry stock that ishosted in the metasediments. Mineralization in this zone is distributed irregularly around theporphyry stock with the majority occurring on the western side of the porphyry. Mineralizationoccurs in all three alteration types: advanced argillic, phyllic and potassic. Further work duringsubsequent phases of study will be planned with a view to converting the mineralized metasedimentto an indicated resource, and subsequently a probable reserve.
Project Status: The Golpu PFS was undertaken as a standalone scenario and also in parallel with theLink Zone and NRG1 resources (Wafi PFS). The pre-feasibility studies indicate that an annualproduction rate of 10 million tons is achievable, utilizing the block cave mining method. Ore isplanned to be mined from the block cave, and conveyed via an underground decline to a processingplant located in the Eastern foothills of the Watut River Valley, some 4 kilometers west of thedeposit. Concentrate produced will be either pumped or truck-hauled to the port of Lae fordispatch to smelting markets. Production of copper metal on site has not been considered duringthe current phase of study. The cost of power at the site is presently high, with on site heavyfuel oil generation. It is not expected that on-site metal production will be viable unless powercost can be substantially reduced.
Additional Prospects and Exploration Potential: The Golpu and Wafi pre-feasibility studies focusedon developing the Golpu copper-gold, the high-grade gold link zone mineralization and thenon-refractory (oxide) portion of the A and B zone gold mineralization. However, excellentprospects remain in the immediate vicinity of the existing resource areas for porphyry Cu-Au andrelated epithermal Au mineralization. During fiscal 2008, the focus of the exploration program waswithin a 2 km radius of the Wafi Golpu deposits, and the Nambonga North Prospect has beenidentified where drilling has obtained a number of significant porphyry Cu-Au intercepts. AtWestern Zone, drilling has intersected high-grade Au mineralization similar to that of the LinkZone.
Nambonga North
Introduction: Nambonga North prospect lies approximately 2 km northwest of the Golpu deposit offthe northwest margin of the diatreme. Initial exploration drilling tested a magnetic target with acoincident Cu-Mo geochemical anomaly at surface, and an Electromagnetic anomaly at depth outlinedpotential for a major zone of Au-Cu stock work mineralization associated with a separate porphyryintrusive. The drilling also intersected massive sulphide mineralization containing zinc lead andsilver. Drilling during fiscal 2008 totaled 13 holes for 5,827m.
Project Status: Systematic step-out drilling at the prospect remains in progress on sections spaced80m apart. This program will continue into the first half of fiscal 2009 to outline the limits ofmineralization.
Western Zone
Introduction: Western Zone is located approximately 1.8 km west of the Golpu deposit and liesapproximately 400m north of the Link zone off the western margin of the diatreme. Drilling duringfiscal 2008 comprised 3 holes for 1,484m. Several intervals of high grade gold mineralization havebeen intersected, and like the Link Zone mineralization are associated with arsenical pyrite.
Project Status: Additional drill testing are planned in fiscal 2009 to test the down dipcontinuity of the mineralization.
Wafi Regional Exploration
Introduction: Porphyry copper-gold and stand-alone gold targets represent the best potential tocrystallize value from the Wafi tenement group. Reprocessing of regional magnetics has outlined 7discrete magnetic targets within a 14 km radius of the Wafi Golpu project. These all have thepotential to deliver major gold or copper-gold systems in areas where there has been little or noprevious exploration.
Project Status: Fiscal 2008 exploration focused on the Biamena Prospect. Planned for fiscal 2009is first-pass exploration by way of soil and stream sediment sampling, mapping and reconnaissancerock chip sampling, and first pass reconnaissance drilling is planned for the remaining 6 targets(Mt. Tonn, Kendix, Bawaga, Zenapu, Mid Nambonga Yor Creek, Kesiago).
Biamena
Introduction: Biamena prospect lies approximately 12 km south of the Golpu deposit on EL1316. Theprospect area was prioritized for follow-up work based on highly anomalous Cu-Au stream sedimentgeochemistry coincident with an intrusive unit evident in the magnetics.
77
Project Status: Work during fiscal 2008 has included surface trenching and soil sampling (1500Samples), IP survey (80 line kilometers), and first pass drilling (2 holes 749m). Gold and copperresults obtained from this work have been encouraging. Follow-up diamond drilling will be plannedand scheduled based on integrated geochemical, geological and geophysical datasets during fiscal2009.
78
REGULATION
Mineral Rights
South Africa
South African law provides for the separate ownership of surface and mineral rights. Prior tothe promulgation of the MPRDA on May 1, 2004, it was therefore possible for one person to own thesurface of a property, another to own rights to precious metals, and yet another to own rights tobase minerals. In terms of the MPRDA, all mineral rights in South Africa are now vested in theSouth African state. The principal objectives of the Act are:
| | • | | to recognize the internationally accepted right of the state of South Africa to exercise full andpermanent sovereignty over all the mineral and petroleum resources within South Africa; |
| |
| | • | | to give effect to the principle of South Africa’s custodianship of its mineral and petroleum resources; |
| |
| | • | | to promote equitable access to South Africa’s mineral and petroleum resources to all the people ofSouth Africa; |
| |
| | • | | to substantially and meaningfully expand opportunities for HDSAs including women, to enter the mineraland petroleum industry and to benefit from the exploitation of South Africa’s mineral and petroleumresources; |
| |
| | • | | to promote economic growth and mineral and petroleum resources development in South Africa; |
| |
| | • | | to promote employment and advance the social and economic welfare of all South Africans; |
| |
| | • | | to provide security of tenure in respect of prospecting, exploration, mining and production operations; |
| |
| | • | | to give effect to Section 24 of the South African Constitution by ensuring that South Africa’s mineraland petroleum resources are developed in an orderly and ecologically sustainable manner whilepromoting justifiable social and economic development; and |
| |
| | • | | to ensure that holders of mining and production rights contribute towards socio-economic developmentof the areas in which they are operating. |
Under the MPRDA, tenure over established mining operations is secured for up to 30 years (andrenewable for periods not exceeding 30 years each thereafter), provided that mining companies applyfor new order mining rights over existing operations within five years of May 1, 2004, or beforethe existing right expires, whichever is the earlier date and fulfill requirements specified in theMPRDA and the Mining Charter.
The Mining Charter was signed by government and stakeholders in October 2002 and containsprinciples relating to the transfer, over a ten-year period, of 26% of South Africa’s mining assets(as equity or attributable units of production) to HDSAs, as defined in the Mining Charter. Aninterim target of 15% HDSA participation over 5 years has also been set and to this end, the SouthAfrican mining industry has committed to securing financing to fund participation of HDSAs in anamount of R100.0 billion within the first five years of the Mining Charter’s tenure. The MiningCharter provides for the review of the participation process after five years to determine whatfurther steps, if any, are needed to achieve the 26% target participation. In order to measureprogress in meeting the requirements of the Mining Charter, companies are required to complete a“Scorecard”, in which the levels of compliance with the Mining Charter can be ticked-off after fiveand ten years respectively. The Mining Charter and Scorecard require programs for black economicempowerment and the promotion of value-added production, such as jewelry-making and other goldfabrication, in South Africa. In particular, targets are set out for broad-based black economicempowerment in the areas of human resource and skills development; employment equity; procurementbeneficiation and direct ownership. In addition, the Mining Charter addresses socio-economic issuessuch as migrant labor, mine community and rural development, and housing and living conditions.
We actively carry out mining and exploration activities in all of our material mineral rightsareas. Accordingly, the MPRDA has not had a significant impact on these mining and explorationactivities because we are eligible to apply for new licenses over our existing operations, providedthat we continue to comply with the Mining Charter. All of our new order licenses have beengranted.
We have already complied with the requirements of the Mining Charter, with an equivalent of34% of production ounces qualifying as empowerment credit ounces. We have been working on ourprogram of licensing since 2004, which involved the compilation of a mineral assets register andthe identification of all of our economic, mineral and mining rights. We have secured all “oldmining rights” and validated existing mining authorizations. Our strategy has been to secure allstrategic mining rights on a region-by-region basis. The first application for conversion from “oldorder” to “new order” mining rights was for the Evander Operations and was lodged on May 21, 2004.The Evander
79
mining license was the first conversion application in the region and in October 2004 we became the first senior company to convert “old order” to “new order” miningrights for our Evander and Randfontein operations. We have worked closely with the DME to helpensure, to the extent we are able, that the licenses are granted as swiftly as possible. Theconversion of licenses for all our remaining operations were granted during November 2007 andDoornkop will be executed in October 2008.
The MPRDA makes reference to royalties being payable to the South African government in termsof the Mineral and Petroleum Resources Royalty Bill which has not yet been enacted by Parliament.The fourth draft of the Mineral and Petroleum Resources Royalty Bill was tabled in Parliament onAugust 21, 2008 and provides for the payment of a royalty according to a formula based on earningsbefore interest, tax and depreciation. This rate is then applied to revenue to calculate theroyalty amount due, with a minimum of 0.5% and a maximum of 5% for gold. It is estimated that theformula could translate to a royalty rate of more than 2% of gross sales in terms of currentpricing assumptions. The latest proposal results in a large increase from the 1.5% rate proposed inthe second draft in 2006. Should the bill be passed by Parliament in its current form, the royaltywill become effective on May 1, 2009.
The MPRDA intends to, among other things:
| | • | | give effect to the Minister’s stated intention to promote investment in the SouthAfrican mining industry; |
| |
| | • | | establish objective criteria for compliance with the MPRDA’s socio- economic objectives; |
| |
| | • | | remove the technical deficiencies of the MPRDA; |
| |
| | • | | align the MPRDA with the Promotion of Administrative Justice Act, 2000; and |
| |
| | • | | coordinate the environmental requirements between the MPRDA and the NationalEnvironmental Management Act. |
PNG
The Mining Act of 1992 (PNG) is based on Australian legislation. Accordingly, mineral rightsin PNG also belong to the government of PNG and they have a statutory right to obtain up to a 30%participating interest in mining development projects. The government then issues and administersmining tenements under the relevant mining legislation, and mining companies must pay royalties tothe government based on production.
The key difference in PNG is that citizens have the right to carry out non-mechanized miningof alluvial minerals on land owned by them. These customary rights do not extend over a mininglease, unless an alluvial mining lease is obtained.
Almost all land in PNG is owned by a person or group of persons, and is not generally overlaidby landowner title issues. There is, however, considerable difficulty in identifying landowners ofa particular area of land because land ownership may arise from both contract and inheritance, andbecause of the absence of a formal written registration system.
Prior to commencing exploration, compensation for loss or damage must be agreed with thelandowners. Prior to commencing mining, a written agreement must be entered into with landownersdealing with compensation and other matters.
In PNG, Morobe Consolidated Goldfields Limited (“Morobe") holds a mining lease and variousexploration licenses granted by the Department of Mining for the Hidden Valley Project. Morobe hasalso entered into a memorandum of agreement with the state, local government and the landowners.
Wafi Mining Limited holds various exploration licenses granted by the Department of Mining forthe Wafi/Golpu Project, and has entered into a compensation agreement with landowners on one of itsexploration licenses.
In PNG there are no applicable exchange control restrictions but the PNG central bank doeshave to be informed of all transactions and has to approve lending facilities and interests ratescharged.
Environmental Matters
South Africa
We are committed to conducting our business in an ethically, morally socially andenvironmentally responsible manner that will protect human health, natural resources and theenvironment in which we live. We aim to balance our economic, social and environmental goals andresponsibilities to achieve sustainable, profitable growth in our business and, more importantly,to work with communities and regulatory agencies to implement sound management practices which willensure that our mining is conducted in an environmentally-safe manner. In addition, with regard tolegacy mining impacts, we remain committed to identifying and implementing coordinated remediationplans that are acceptable to all relevant parties.
80
In support of the above commitment, our environmental policy stipulates that:
| | • | | Compliance |
| |
| | | | We will integrate environmental policies, programs and practices intoall activities and policies of the organization as well as monitor theperformance of these programs. We will strive to comply with allapplicable municipal, provincial and national laws and regulations, aswell as the other requirements to which we subscribe that are relevantto the environmental aspects of our activities, and encourage suchcompliance from those organizations with whom we do business; |
| |
| | • | | Continual Improvement
We will evaluate and continually improve the effectiveness of ourenvironmental management system through periodic audits, managementreviews, and by achieving our environmental objectives. We will reviewthis Environmental Policy annually and make it available to thepublic; |
| |
| | • | | Pollution Prevention
We will actively design, operate, and maintain our mining activitieswith a focus on pollution prevention. We will strive towards thecontinual reduction of adverse environmental effects, supporting theprinciple of sustainable development; |
| |
| | • | | Awareness
We will communicate this Environmental Policy to employees,contractors and suppliers to ensure their awareness of our commitmentto the environment. We will provide appropriate training to allemployees to ensure their continuing awareness of environmentalresponsibilities. |
In order to address and minimize the impact of our operations on the environment and takecognizance of the regulatory requirements, the following 5-year targets have been approved by theBoard:
| | | | | | | | | | | |
| Scope of | | | | | | Measurement | | Comparable | | |
| Regulation | | Aspect | | Element | | Criteria | | Standard (GRI) | | Target |
APPA/AQA | | Air Emissions | | Electricity | | kWh/ton
treated/mined | | x | | 15% reduction |
| | | | Fuels(Diesel/Petrol) | | Litres/CO2
equivalents | | √ | | 15% reduction |
| | | | Dust | | g/m2/day | | x | | 15% reduction |
| | | | Methane | | CO2 equivalents | | √ | | 30% reduction |
| | | | Coal (domestic) | | t/year | | √ | | 50% reduction |
NWA | | Water | | Consumptive Use | | m3/tontreated/mined | | x | | 10% reduction |
| | | | Metal/SaltDischarge: | | | | | | |
| | | | - surface | | tons | | x | | 70% reduction |
| | | | - underground | | tons | | x | | 20% reduction |
MPRDA and NNRA | | Land - recycle | | steel | | tons | | √ | | All waste will behandled throughdesignated areas. |
| | | | plastic | | tons | | x | |
| | | | timber | | tons | | √ | |
| | | | Oil/grease | | litres | | √ | | 50% recycled |
| | Land - use | | impacted | | ha | | √ | | 10% reduction |
Our approach to environmental management encompasses the following four broad principles:
| | • | | all relevant environmental risks should be identified and prioritized; |
| |
| | • | | environmental issues should be dealt with promptly; |
| |
| | • | | environmental issues, particularly relating to continuousnon-compliance or potentially serious environmental impacts, should benotified and dealt with at the board level; and |
81
| | • | | we will adopt the best practicable environmental option; that is, theoption that has most benefit, or causes the least damage to theenvironment, at a cost acceptable to society and affordable to us. |
We developed our environmental policy in consultation with various stakeholders such as minemanagers, employees and unions, and which has the approval of the Chairman of the SustainableDevelopment Committee and the Chief Executive. It has also been adopted by each mine manager atsigning ceremonies held at each shaft. It commits shafts to returning their areas of operation “asclose as possible to the pre-mining state, thus creating sustainability and economic viability forgenerations to come”.
The main areas of the policy are:
| | • | | that environmental management is a corporate priority; |
| |
| | • | | that environmental policies, programs and practices will be integrated into our activities; |
| |
| | • | | that we will strive for continued improvement and efficiency; |
| |
| | • | | that we will work with government departments and the public to come up with the bestsustainable solutions; |
| |
| | • | | that contractors and suppliers will be required to comply with our policy; and |
| |
| | • | | that employees will be informed and educated regarding their environmental responsibilities. |
The focus was on implementing an environmental management policy at an operational levelduring fiscal 2007. During fiscal 2008, we continued the adoption of the ISO 14001 specification asthe Environmental Management System (“EMS”) for the South African operations. The EMS is astructured approach for addressing the triple bottom-line (that is, social, economic andenvironmental), and forms the basis of environmental management at an operation level. ISO 14001is a recognized and widely adopted EMS framework.
The ISO4001 EMS is being introduced progressively throughout our South African operations.The planned program completion for this region is 2012. As at September 30, 2008, theimplementation status is as follows:
| | | |
Operation: | | Implementation Status: |
Doornkop | | 85%(with the Stage 1 external audit scheduled by end of November2008) |
Target | | 65% |
Elandsrand | | 65% |
Phakisa | | 55% |
Environmental policy and strategy within our business, as well as the environmental impact ofour operations on regional communities, are overseen by the Sustainable Development Committee. Themanagement of environmental issues at operational level is the responsibility of each divisionalChief Operational Officer, who is supported by line management in the various regions. Structureand reporting mechanisms are in place to ensure that the Board is kept fully informed, on aquarterly basis, of environmental matters within the group as well as progress made towardsachieving targets set for key parameters.
The Environmental Management Function (“EMF”) has been structured to support operationalgoals. Primarily, this means it will ensure reasonably practicable compliance with legislation, andthe promotion of environmental awareness. At a regional level, environmental management managersprovide advice and support to the relevant operational management teams. Given the diversity of theenvironmental issues being dealt with, one of the environmental challenges facing the operations isto effectively access the diverse range of skills necessary to address environmental issues.Concurrent rehabilitation and mitigation capacity resides within the various operational functions,such as surface engineering, metallurgy, etc. Where specific capacity is lacking in-house, use ismade of external consultants with appropriate specialist expertise. Operational personnel areassisted by the EMF to determine the scope of work and consultants are selected and employed as theneed arises. Their selection is conducted in terms of our procurement policy. Regionalenvironmental managers meet on a quarterly basis as part of a process to encourage networking,information sharing and joint problem-solving. Staff members are encouraged to develop their skillsthrough on-the-job training and external opportunities such as conferences and short courses.Current complements provide for further strengthening of the skills base of the EMF in line withour commitments. We support future staffing in the environmental area by mentoring two graduates(in the discipline) to fill future roles within our business. The process of rehabilitation hasbeen given a boost with the appointment of a group level
82
Environmental Manager specificallycharged with accelerating the rehabilitation of specific target areas with a view to obtainconcurrent closure instead of the approach of viewing final mine closure at the end of life ofmine.
With this new appointment, we have initiated a process of identification and planning aroundenvironmentally sensitive sites in both the north and south regions to be rehabilitated in linewith the requirements of the MPRDA and other relevant legislation. These areas have beenidentified for rehabilitation as part of our progressive rehabilitation and closure planningprogram, a predecessor program to the final mine closure plan (for the entire mine) for activitieswhich must be carried out after production of minerals from the mine or when mining has ceased.
Rehabilitation and closure plans are being developed internally for targeted areas where anurgent need for rehabilitation and formal closure has been identified. External expertise will beutilized should the need arise. Obtaining approval from the relevant authorities (notably DME,Department of Water Affairs and Forestry (“DWAF”) and, in some cases, National Nuclear Regulator(“NNR”)) for the rehabilitation and closure plans is essential.
The rehabilitation programs are aimed at making the area suitable for future land developmentwith a goal of achieving positive socio-economic spin-offs.
Land use objectives are established in consultation with relevant government departments,local authorities, landowners and all relevant Interested and Affected Parties (“IAP”). IAPconsultation forms part of the planning and development process as it is a prerequisite to closureplan approval. Obtaining the authorities’ approval (notably DME, DWAF and in some cases the NNR)on the rehabilitation and closure plans is of the essence. The rehabilitation programme is aimedat making the area suitable for future land development with positive socio- economic spin- offs tobe realised therefrom. Land use objectives are established in consultation with relevant governmentdepartments, local authorities, landowners and all relevant interested and affected parties. IAPconsultation forms part of the planning and development process which is a prerequisite to closureplan approval.
Our environmental management strategy, which has been updated and given the full support ofour Board and CEO, is guided by the environmental policy by prevailing environmental laws and theEMPRs developed by us for each operation and approved by the DME which are legally binding. We arenot aware of any litigation, current or pending, against us in this regard.
During the fiscal 2005, we were issued with directives from DWAF related to the collection,removal and re-use or disposal of extraneous groundwater in the Klerksdorp, Orkney, Stilfontein andHartebeestfontein (“KOSH”) area. This follows the liquidation of the DRDGOLD North West operationsin this area and the subsequent liquidation of Stilfontein, which brought an end to their pumpingactivities and threatened to flood other mines in the area. In February 2007, Harmony, AngloGoldAshanti and Simmer Jack Mines Limited entered into an agreement pursuant to which Margaret WaterCompany (“MWC”) was formed to manage the water emanating from the now defunct Stilfontein GoldMine. MWC and the three mining companies entered into a loan agreement for the provision of a loanof R18.0 million (U.S.$2.56 million) from each mining company to MWC as seed funding forstabilization of the infrastructure.
The Western Basin Environmental Corporation (“WBEC”) is in the process of funding thenecessary infrastructure improvements to ensure the sustainability of the pumping operations. Itcontinues to be managed by directors appointed by each of the relevant mining houses. The WesternUtilities Corporation (“WUC”) established in order to fund the treatment of the water on asustainable basis has secured sufficient offshore funding from offshore investor. WUC has enteredinto a management agreement with WBEC and has built and successfully operated three pilot plantsover the last 8 months. The results of these trials are being analyzed and the full viabilityreport will be available by the end of calendar 2008.
The KOSH obligations have passed to Pamodzi with the sale of the Orkney operations to thatcompany.
We are expecting a revised DWAF directive pertaining to the water management of the WesternMining Void water decant during October 2008, which is expected to cover operating conditionsleading up to final solution following the pilot work. Currently, we are in compliance with theregulators’ requirements within the operating constraints of the water treatment plan. We are alsoin regular contact with DWAF in this regard, and are actively minimizing our water dischargequantity by re-use in our metallurgical facilities.
EMS forms the basis for the implementation of the environmental policy and monitoringcompliance. All of the South African operations function within the requirements and conditions ofthe EMPRs that have been approved by the DME. These EMPRs contain specific as well as genericprinciples relating to environmental management during the operation of the mine. Closureobjectives are set and closure plans
83
formulated within theEMPR. The latter includes investigation of the potential for re-use of existing infrastructure,preparation of a rehabilitation plan, rehabilitation and vegetation of the affected area andpost-closure monitoring. Conversion to new order mining rights in line with the MPRDA requires thatmining companies report on the extent of compliance with their approved EMPRs. The EMPRs identifyindividual impacts, mitigation measures and rehabilitation requirements. These have been used asthe basis for the development of a proprietary EMS, which is currently being tested, populated withinformation, and rolled out to the various operations. This proprietary EMS, which encompasses theprinciples of ISO 14000, is an electronic-based system. The proprietary EMS encompasses thefollowing activities:
| | • | | Environmental inspection: general inspections are performed routinely and systematically withcollected data entered into the system to enable follow-up actions. |
| |
| | • | | Risk assessment: detailed and specific risk assessments are conduced to help identifydeviations that may not have been otherwise anticipated. |
| |
| | • | | Stakeholder communication: all communication is managed and may result in action items forthe organization for which the stakeholder will require follow-up feedback. All suchcommunication is logged. |
| |
| | • | | Monitoring: impact monitoring is focused on collecting and analyzing environmental data thatmay well result in follow-up actions. |
| |
| | • | | Licenses/permits: all details relating to licenses or permits can be registered in the system. |
| |
| | • | | Major loss, incident and accident notification: when an incident occurs, initial informationabout the incident is recorded to trigger a notification process. |
The bulk of our significant impacts are historic, and are currently managed in terms ofsite-specific procedures or codes of practice. Any major operational changes will, in future, takecognizance of the Environmental Impact Assessment (“EIA”) process and adhere to the outcomes ofsuch studies. Furthermore, the continued development of EMSs, with respect to site monitoring andrisk assessment, will allow for the inclusion of specific evaluation criteria in thedecision-making process. We have conducted internal compliance assessments on all of our EMPRs.Assessments and non-compliance areas are being addressed. The results of the compliance assessmenthave been included in the application for conversion to new order mining rights.
In accordance with legislation, we have established seven independent environmentalrehabilitation trust funds to make adequate financial provision for the expected cost ofenvironmental rehabilitation at mine closure and for the discharge of our obligations andcontingency liability. Each operation estimates its expected environmental closure liabilityannually and this estimated amount is used to calculate the contributions to be made to therehabilitation trust funds. The contributions are spread over the operational life-of-mine andcontributions are made by each operation on an annual basis. The accumulated amount in the variousSouth African rehabilitation trust funds as at June 30, 2008 was U.S.$205.5 million, while thetotal rehabilitation liability was U.S.$173.6 million in current monetary terms.
The assets of each mine within each fund are ring-fenced and may not be used tocross-subsidize one another. Contributions to the various funds will continue to be made over theoperations’ life-of-mine and each fund is expected to be fully-funded at the time of closure.Sudden and accidental pollution is covered under our public liability insurance policy. The AssetManagement Committee formed during fiscal 2006 continues to co-ordinate the activities related tothe disposal of assets and subsequent closure of redundant operational sites to an environmentallyacceptable standard. The EMF is represented on the committee at senior management level. Animportant element of this committee’s work is to investigate alternative and appropriate land use,particularly in respect of those assets for which closure is being planned.
Pursuant to South African law, mine properties must be rehabilitated upon closure. Miningcompanies are required by law to submit EMPRs, to the DME. EMPRs identify the rehabilitation issuesfor a mine and must also be approved by other South African government departments including, butnot restricted to the DWAF.
EMPRs have been prepared and submitted for all of our South African operations. All of ourSouth African mining operations have permanent mining authorizations as required in terms of theprevious Minerals Act 1991. We have already obtained all new order mining rights. We meet with andintend to continue to meet on a regular basis with the relevant government departments to continuethe information sharing process that we have with them and to ensure the environmental impact ofour mining operations are managed in accordance with applicable regulatory requirements andindustry standards.
84
All water uses are now in the process of being licensed, and we have submitted water-useregistrations required by the National Water Act of 1998. We have also developed water managementplans for all of our South African operations. This process is now extended to a full review and submission of Water UseLicense applications, which will take into account all water-related issues as well as plannedprojects.
In addition, an environmental surveillance system has been implemented at slimes dams at ouroperations to monitor dust generation and fall-out in residential and other areas. This will assistin future dust suppression and the design and measurement of rehabilitation programs. In excess ofR5 million (U.S.$0.7 million) has been spent in contouring the tops of the slimes dams concernedand to provide wind erosion containment measures and the supply of sewage discharge water toinitiate vegetation growth in the coming season has been completed. In addition, spraying of theleading edges of the dams and dumps with eco-friendly palliatives to bind the soils in the shortterm is ongoing, although the palliatives have had limited success in binding the dust particles,further tests are ongoing.
Australia
Our Western Australian Mt. Magnet operations are subject to applicable environmentallegislation, and also specific site conditions attaching to the mining tenements imposed by theDepartment of Industry and Resources, to the operating licenses issued by the Department ofEnvironmental Protection, and also to the water abstraction licenses issued by the Water and RiversCommission.
As a result, we must make provision for environmental rehabilitation whenever miningoperations are conducted. While we believe that our current provision for compliance with suchrequirements is reasonable, any future changes and development in Australian environmental laws andregulations may adversely affect these Australian operations. The total Australian rehabilitationliability was A$20.3 million (U.S.$19.4 million) at the end of fiscal 2008.
In Western Australia, rehabilitation obligations under the Mining Act are covered byenvironmental securities issued by us, or by performance bonds issued by our bankers andcash-backed by us. These bonds cannot be relinquished or cancelled without the approval of theDepartment of Industry and Resources. The amount of the bond is established prior to issuance ofthe tenement and commencement of operations, and generally is audited by the regional inspector.Thereafter, the amount is reviewed on an annual basis following our issuance of an annualenvironmental report. As areas are successfully rehabilitated, the bond requirement is reduced.
Audits are generally conducted on a bi-annual basis by the Australian Department ofEnvironmental Protection to determine compliance with the relevant operating license(s). There arecurrently no outstanding material non-compliance issues against our licenses.
At each of our mines, we appointed a person dedicated to environmental matters who, inaddition to organizing the implementation of the environmental management programs, monitors theimpact of mining on the environment and responds to impacts that require specific attention outsideof the normal program of environmental activities.
The primary environmental focus at most of our operations is water management and theadministration of areas outside the operating plants and shafts. The major objective is to ensurethat water is of a quality fit for use by downstream users.
Based on current environmental and regulatory requirements, we accrue for the estimatedrehabilitation expense in full when mining commences and then amortizes these environmentalrehabilitation costs over the operating life of a mine.
PNG
Our PNG operations are in exploration, pre-feasibility study and project construction phases,and mining has not yet commenced. We are subject to applicable environmental legislation includingspecific site conditions attaching to the mining tenements imposed by the PNG Government Departmentof Environment and Conservation (“DEC”), to the terms and conditions of operating licenses issuedby the Department of Mines and DEC, and also to the environment permit for water abstraction anddischarge issued by DEC.
The current status of our PNG projects can be summarized as follows:
The Hidden Valley project is in the construction phase. The project has obtained and is incompliance with all permits and licenses required for the current stage of the project’sdevelopment. The access road to the Hidden Valley project site has been completed with part of theroad sides successfully re-vegetated. The foundations have been completed for accommodation andadministration buildings for the general mine
85
infrastructure. Excavation is underway for the plantsite, tailings storage facility and the access road to the open-pit. Government approval has been given to amend the environment permit based on an updatedfeasibility study for the site.
The Wafi Golpu project is presently undertaking pre-feasibility studies. The project hasobtained, and is in compliance with, all permits and licenses for the current stage of theproject’s development.
Harmony PNG is committed to working within the framework of corporate EMS in accordance withthe international EMS standard, ISO 14001:2004, adapted for use in Australia and New Zealand asAS/NZS ISO 14001:2004 and the Equator Principles of the World Bank. These standards provide HarmonyPNG with the elements of an effective EMS, that is, a procedure for implementing, achieving,reviewing and maintaining our environmental policy, and also incorporates good industryenvironmental management practices, which form the basis of a project-specific EMS.
An EMS is a structured approach to managing an environmental program, and provides a qualitysystem to guide:
| | • | | development and implementation of environmental management procedures; |
| |
| | • | | monitoring of environmental impacts and performance; and |
| |
| | • | | review of procedures to ensure continual improvement. |
86
Health and Safety Matters
South Africa
The Mine Health and Safety Act
For many years, the safety of persons working in South African mines and quarries wascontrolled by the Mines and Works Act of 1956 and then by the Minerals Act of 1991 which wasreplaced by the Mine Health and Safety Act. The Minerals Act of 1991 has subsequently been repealedand the MPRDA promulgated. The findings of the Leon Commission of Inquiry into Health and Safety inthe Mining Industry (held in April 1994) culminated in the Mine Health and Safety Act, which was aproduct of intensive discussion and debate between government, employers and employeerepresentatives over an extended period of time. The objectives of the Mine Health and Safety Actare:
| | • | | to protect the health and safety of employees and other persons at mines; |
| |
| | • | | to promote a culture of health and safety; |
| |
| | • | | to require employers and employees to identify hazards and eliminate, controland minimize the risks relating to health and safety at mines; |
| |
| | • | | to give effect to the public international law obligations of South Africa thatconcern health and safety at mines; |
| |
| | • | | to provide for employee participation in matters of health and safety throughhealth and safety representatives and health and safety committees at mines; |
| |
| | • | | to provide for the effective monitoring of health and safety conditions at mines; |
| |
| | • | | to provide for the enforcement of health and safety measures at mines; and |
| |
| | • | | to foster and promote co-operation and consultation on health and safety betweenthe Department of Minerals and Energy, employers, employees and theirrepresentatives. |
The Mine Health and Safety Act prescribes general and specific duties for employers andothers, determines penalties and a system of administrative fines, and provides for employeeparticipation by requiring the appointment of health and safety representatives and theestablishment of health and safety committees. It also entrenches the right of employees to refuseto work in dangerous conditions. Finally, it describes the powers and functions of the mine healthand safety inspectorate and the process of enforcement.
Government, through the Department of Minerals and Energy, ordered the institution of auditteams to conduct legal compliance and systems and explosives control audits on mines across allcommodities.
It is anticipated that mining companies will incur additional expenditure in order to complywith the prescribed legislative requirements. Management anticipates that such additionalexpenditure will not have a material adverse effect upon our operational results or financialcondition.
HIV& AIDS Policy
We are actively pursuing holistic HIV & AIDS awareness campaigns with our South Africanworkforce and are also providing medical assistance and anti-retroviral treatment. Employees whodecide to leave their place of work and return home for care are cared for at their homes throughthe TEBA home based care system, to which we contribute. See “Risk Factors — Risks Relating to OurBusiness and Our Industry — HIV & AIDS poses risks to Harmony in terms of productivity and costs”and “Risk Factors — Risks Relating to Our Business and Our Industry — The cost of occupationalhealthcare services may increase in the future”.
In South Africa, we have an agreement with the relevant stakeholders concerning the managementof HIV & AIDS in the workplace. This agreement, originally signed in 2002 with the National Union ofMine Workers (“NUM”) and the United Association of South Africa (“UASA”) was amended for the thirdtime in August 2006. While many aspects of the policy have remained unaltered, the most fundamentalchange is the inclusion in the policy of a broad spectrum of chronic manageable diseases other thanHIV & AIDS such as diabetes, asthma and hypertension. This was done in order to minimize the stigmasurrounding stand alone HIV & AIDS treatment centers and also to emphasize our view that HIV & AIDSshould no longer be viewed as a death sentence, but rather a chronic, manageable disease. Theagreement also serves to reassure our employees of our commitment to the respect of all humanrights. During the early stages of the implementation of the HIV & AIDS program, the agreement wasalso used as a marketing tool to encourage employee participation in the Harmony HIV & AIDS Program.
Our HIV & AIDS Program, fully supported at all levels of management, is overseen by a qualifiedmedical practitioner together with the assistance of qualified consultants and experts. InSeptember 2005, an independent consultant, the Health Monitor Group, undertook a second
87
businessimpact assessment for the group. Based on actuarial information, theassessment revealed that the prevalence rates of HIV & AIDS within ourbusiness have stabilized at around 30%. This result was in line with the first or baselineassessment that was done in 2003. The introduction of Highly Active Anti-Retroviral Therapy hasalso helped to manage the treatment of HIV & AIDS infected employees. The effectiveness of thesemeasures will only be determined over time. We are currently negotiating an agreement on theTraditional Health Practitioners with the NUM and we have a contracted a dually qualified WesternDoctor/Traditional Health Practitioner who attends to patients once weekly at the clinic inRandfontein and also advises us in view of the pending National Traditional Health PractitionersBill. A third HIV & AIDS impact assessment will be completed by the end of December 2008, and theeffects of the availability of anti-retroviral drugs will only begin to show on the currentanalysis. The issue has not yet been finalized by the Harmony Council because through thesenegotiations management identified a need for a workshop on the bill to ensure that all negotiatingparties have the same information and understanding on the contents of the bill. We are currentlyawaiting a date for the workshop from the National Department of Health’s Traditional HealthPractitioner’s Office.
In fiscal 2008, there were 82 documented AIDS related deaths as compared to 52 in fiscal 2007and 49 in 2006. In addition, 166 employees left as a result of medical repatriation in fiscal 2008as compared to 783 in fiscal 2007 and 1,572 in fiscal 2006. Medical repatriations refer to thoseemployees who are not sufficiently well to continue working with us and are thus provided with anearly and humane exit.
We embarked upon a holistic and integrated campaign in fiscal 2008 in which approximatelyR19.0 million (U.S.$2.6 million) was spent.
Australia
Australia has a well regulated system of occupational health and safety, comprised oflegislation and regulations in each of its states. Several of these specifically apply to themining industry, including extensive codes of practice and guidelines. There is also a welldeveloped certification and licensing system for employees and the usage of certain items ofequipment. The legislation and regulations governing this area include the Australian Standards4804, the Safety Management Systems and the Western Australian Mining Regulation Act 1994, theOccupational Safety and Health Act 1984 (WA), the Occupational Safety and Health Regulations 1996,the Mines Safety and Inspection Act 1994 (WA) and the Mines Safety and Inspection Regulations 1995.
In the event of injury while at work, employees are protected by a compulsory workerscompensation scheme.
We currently believe that the prevalence of HIV & AIDS-related diseases among our Australianworkforce is not material to our Australian operations.
PNG
PNG has a significant mining industry, and a developing system of occupational health andsafety. The Mining (Safety) Act of 1977 (PNG) is the principal legislation that addresses a rangeof issues such as working hours, minimum safety and reporting requirements. Other legislation andregulations also apply.
Although reliable statistics with regard to infection rates are not readily available,preliminary results indicate that PNG is in the early stages of an AIDS pandemic. As part of thedevelopment of the Hidden Valley project, and other exploration activities carried out by us inPNG, we have rolled out a health care strategy for our employees to increase Aids awareness. See“Risk Factors — Risks Relating to Our Business and Our Industry — HIV/AIDS poses risks to Harmonyin terms of productivity and costs” and “Risk Factors — Risks Relating to Our Business and OurIndustry — The cost of occupational healthcare services may increase in the future”.
88
Item 4A. UNRESOLVED STAFF COMMENTS
Not applicable.
89
Item 5. OPERATING AND FINANCIAL REVIEW AND PROSPECTS
You should read the following discussion and analysis together with the consolidated financialstatements, including the related notes, appearing elsewhere in this annual report.
Overview
We conduct underground and surface gold mining and related activities, including exploration,processing, smelting and beneficiation. Our operations have grown significantly since 1995, largelythrough acquisitions. Since 1995, we have expanded from a lease-bound mining operation into anindependent world-class gold producer. We are currently the third largest producer of gold in SouthAfrica, producing some 23.4% of the country’s gold output, and are among the world’s top ten goldproducers. Our gold sales have increased from 650,312 ounces of gold in fiscal 1995 toapproximately 1.9 million ounces of gold in fiscal 2008. As at June 30, 2008, our mining operationsreported total proven and probable reserves of approximately 50.5 million ounces and in fiscal2008, we processed approximately 25.4 million tons of ore.
Previously, the South African underground operations were treated as three separate reportingsegments for management and reporting purposes, being “Quality”, “Leveraged” and “Growth”. Afterthe “Back to Basics” restructuring, management now distinguishes between “Underground” and“Surface”, with each shaft or group of shafts managed by a team (headed by a single generalmanager) being considered to be an operating segment.
Our South African reportable segments are as follows:
| | • | | Tshepong, Phakisa, Bambanani, Doornkop, Elandsrand, Target, Evanderoperations, Masimong, Virginia operations and Cooke operations(classified as discontinued operations); and |
| |
| | • | | all other shafts and surface operations, including those that treathistoric sand dumps, rock dumps and tailings dams, are groupedtogether under “Other — Underground” or “Other — Surface”. |
Critical Accounting Policies and Estimates
The preparation of our financial statements in accordance with IFRS as issued by the IASBrequires management to make estimates and assumptions that affect the reported results of ouroperations. Actual results may differ from those estimates. We have identified the most criticalaccounting policies upon which our financial results depend. Some of our accounting policiesrequire the application of significant judgment and estimates by management in selecting theappropriate assumptions for calculating financial estimates. By their nature, these judgments aresubject to an inherent degree of uncertainty and are based on our historical experience, terms ofexisting contracts, management’s view on trends in the gold mining industry and information fromoutside sources.
Our significant accounting policies are described in more detail in note 2 to the consolidatedfinancial statements. This discussion and analysis should be read in conjunction with theconsolidated financial statements and related notes included in reporting Item 18. “FinancialStatements”. Management has identified the following as critical accounting policies becauseestimates used in applying these policies are subject to material risks and uncertainties.Management believes the following critical accounting policies, together with the other significantaccounting policies discussed in the notes to the consolidated financial statements, affect itsmore significant judgments and estimates used in the preparation of the consolidated financialstatements and could potentially impact our financial results and future financial performance.
Depreciation and Amortization of Mining Assets
Depreciation and amortization expense is calculated using the units of production method andis based on our current gold production as a percentage of total expected gold production over thelives of our mines. The lives of the mines are estimated by our geology department using proven andprobable mineral reserves, as determined in accordance with SAMREC, JORC and SEC Industry Guide 7.
The estimate of the total expected future lives of our mines could be materially differentfrom the actual amount of gold mined in the future and the actual lives of the mines due to changesin the factors used in determining our mineral reserves, such as the gold price, foreign currencyexchange rates, working costs and working rates. We regularly review the lives of the mines andeconomic capacity of those assets with reference to any events or circumstances that may indicatean adjustment is needed. Given the significance of mining assets to our financial statements, anychanges to the life of mine could have a material impact on the annual amortization charge andmaterially impact on our results of operations and financial conditions. See Item 3.“Key Information — Risk Factors — Harmony’s gold reserve figures are estimated based on
90
a numberof assumptions, including assumptions as to mining and recovery factors, future cash costs ofproduction and the price of gold and may yield less gold under actual production conditions thancurrently estimated.”
Impairment of Property, Plant and Equipment
We review and evaluate our mining assets for impairment when events or changes incircumstances indicate the related carrying amounts may not be recoverable. An impairment loss isrecognized for the amount by which the asset’s carrying amount exceeds its recoverable amount. Therecoverable amount is the higher of an asset’s fair value less costs to sell and value in use. Forthe purposes of assessing impairment, assets are grouped at the lowest levels for which there areseparately identifiable cash flows (cash generating units). Each operating shaft, along withallocated common assets such as plants and administrative offices, is considered to be a cashgenerating unit as each shaft is largely independent of the cash flows of other shafts and assets.
Future cash flows are estimated based on estimated quantities of recoverable minerals, expectedgold prices (considering current and historical prices, price trends and related factors),production levels and cash costs of production, capital and reclamation costs, all based ondetailed life-of-mine plans. The significant assumptions in determining the future cash flows foreach individual operating mine at June 30, 2008, apart from production cost and capitalizedexpenditure assumptions unique to each operation, included a long-term gold price of U.S.$750 perounce and South African and Australian dollar exchange rates of U.S.$1 = R7.46 and A$1 = U.S.$0.80,respectively. The term “recoverable minerals” refers to the estimated amount of gold that will beobtained from proven and probable reserves and related exploration stage mineral interests, exceptfor other mine-related exploration potential and Greenfields exploration potential discussedseparately below, after taking into account losses during ore processing and treatment. Estimatesof recoverable minerals from such exploration stage mineral interests are risk adjusted based onmanagement’s relative confidence in such materials. With the exception of other mine-relatedexploration potential and Greenfields exploration potential, estimates of future undiscounted cashflows are included on an area of interest basis, which generally represents an individual operatingmine, even if the mines are included in a larger mine complex. In the case of mineral interestsassociated with other mine-related exploration potential and Greenfields exploration potential,cash flows and fair values are individually evaluated based primarily on recent exploration resultsand recent transactions involving sales of similar properties.
As discussed above under “Depreciation and amortization of mining assets”, various factorscould impact our ability to achieve our forecasted production schedules from proven and probablereserves. Additionally, gold prices, capital expenditure requirements and reclamation costs coulddiffer from the assumptions used in the cash flow models used to assess impairment. The ability toachieve the estimated quantities of recoverable minerals from exploration stage mineral interestsinvolves further risks in addition to those factors applicable to mineral interests where provenand probable reserves have been identified, due to the lower level of confidence that theidentified mineralized material can ultimately be mined economically. Assets classified as othermine-related exploration potential and Greenfields exploration potential have the highest level ofrisk that the carrying value of the asset can be ultimately realized, due to the still lower levelof geological confidence and economic modeling.
During fiscal 2008, we recorded impairments of U.S.$27 million, and during fiscal 2007 and2006, reversals of impairments of U.S.$19 million and U.S.$30 million, respectively, on property,plant and equipment, all from continuing operations. Material changes to any of these factors orassumptions discussed above could result in future impairment charges.
Carrying Value of Goodwill
We evaluate, on at least an annual basis, the carrying amount of goodwill to determine whethercurrent events and circumstances indicate that such carrying amount may no longer be recoverable.For the purposes of assessing impairment, assets are grouped at the lowest levels for which thereare separately identifiable cash flows (cash generating units). Each operating shaft, along withallocated common assets such as plants and administrative offices, is considered to be a cashgenerating unit as each shaft is largely independent of the cash flows of other shafts and assets.To accomplish this, we compare the recoverable amounts of our cash generating units to theircarrying amounts. The recoverable amount is the higher of an asset’s fair value less costs to selland value in use. If the carrying value of a cash generating unit were to exceed its recoverableamount at the time of the evaluation, we would compare the implied fair value of the cashgenerating unit’s goodwill to its carrying amount and any shortfall would be charged toconsolidated income statements. Assumptions underlying fair value estimates are subject to risksand uncertainties. If these assumptions change in future, we may need to record impairment chargeson goodwill not previously recorded.
During fiscal 2008, we recorded an impairment of U.S.$13 million on goodwill.
91
Provision for environmental rehabilitation
Our mining and exploration activities are subject to various laws and regulations governingthe protection of the environment. Estimated long term environmental obligations, comprisingpollution control, rehabilitation and mine closure, are based on the Group’s environmentalmanagement plans. Annual changes in the provision consist of finance costs relating to the changein the present value of the provision and inflationary increases in the provision estimate, as wellas changes in estimates. The present value of environmental disturbances created is capitalized tomining assets against an increase in the rehabilitation provision. The rehabilitation asset isdepreciated as discussed above. Rehabilitation projects undertaken, included in the estimates arecharged to the provision as incurred. The cost of ongoing current programs to prevent and controlpollution is charged against income as incurred.
Deferred Tax Asset
We do not recognize a deferred tax asset when it is more likely than not that the asset willnot be utilized. Assessing recoverability of deferred tax assets requires management to makesignificant estimates related to expectation of future taxable income. Estimates of future taxableincome are based on forecasted cash flows from operations, reversals of deferred tax liabilitiesand the application of existing tax laws in each jurisdiction. To the extent that future taxableincome differs significantly from estimates, our ability to realize the net deferred tax assetsrecorded at the balance date could be impacted. Additionally, future charges in tax laws in thejurisdictions in which we operate could limit our ability to obtain the future tax benefitsrepresented by deferred tax assets recorded at the balance date.
Revenue
Substantially all of our revenues are derived from the sale of gold. As a result, ouroperating results are directly related to the price of gold. Historically, the price of gold hasfluctuated widely. The gold price is affected by numerous factors over which we do not havecontrol. See Item 3. “Key Information — Risk Factors — The profitability of Harmony’s operations,and the cash flows generated by those operations, are affected by changes in the market price forgold, which in the past has fluctuated widely”.
As a general rule, we sell our gold produced at market prices to obtain the maximum benefitfrom increases in the prevailing gold price and do not enter into hedging arrangements such asforward sales or derivatives that establish a price in advance for the sale of our future goldproduction.
A substantial proportion of the production at each of New Hampton and Hill 50 in Australia wasalready hedged when we acquired them. Since fiscal 2002, in line with our strategy of beinggenerally unhedged, we evaluated the hedge agreements as well as market conditions and closed outthe hedge contracts at the time that provided the most benefits. The last of the contracts wereclosed out during fiscal 2007, which resulted in our being unhedged in line with our stated companypolicy to give shareholders full exposure to the gold price.
Our costs of closing out certain operations hedge positions in fiscal years 2007 and 2006 wasapproximately U.S.$60 million and U.S.$34 million, respectively, before taxes.
Significant changes in the price of gold over a sustained period of time may lead us toincrease or decrease our production in the near-term.
Harmony’s Realized Gold Price
The average gold price in U.S. dollars received by us has generally increased since January 1,2002. In fiscal 2008, the average gold price in U.S. dollars received by us for continuingoperations was U.S.$818 per ounce. The market price for gold (and, accordingly, the price receivedby us) is affected by numerous factors over which we have no control. See Item 3. “Key Information— Risk Factors — The profitability of Harmony’s operations, and the cash flows generated by thoseoperations, are affected by changes in the market price for gold, which in the past has fluctuatedwidely”.
The following table sets out the average, the high and the low London Bullion Market price ofgold and our average U.S. dollar sales price during the past three fiscal years:
| | | | | | | | | | | | | |
| | | Fiscal Year Ended |
| | | June 30 |
| | | 2008 | | 2007 | | 2006 |
| | | | | | | ($/oz) | | | | |
Average | | | 821 | | | | 638 | | | | 527 | |
High | | | 1,011 | | | | 692 | | | | 726 | |
Low | | | 649 | | | | 561 | | | | 418 | |
92
| | | | | | | | | | | | | |
| | | Fiscal Year Ended |
| | | June 30 |
| | | 2008 | | 2007 | | 2006 |
| | | | | | | ($/oz) | | | | |
Harmony’s average sales price — continuing operations (1) | | | 818 | | | | 638 | | | | 529 | |
| | |
| (1) | | Our average sales price differs from the average gold price due to the timing of our salesof gold within each year. |
Costs
Our cash costs and expenses typically make up over 80% of our total costs. The remainder ofour total costs consists primarily of exploration costs, employment termination costs, corporateand sundry expenditure, and depreciation and amortization. Our cash costs consist primarily ofproduction costs exclusive of depreciation and amortization. Production costs are incurred onlabor, stores and utilities. Labor costs are the largest component and typically compriseapproximately 50% of our production costs.
Our cash costs for continuing operations has increased from U.S.$440 per ounce in fiscal 2006to U.S.$591 per ounce in fiscal 2008, mainly as a result of lower production volumes, the impact ofincreased labor and energy costs as well as inflationary pressures on supply contracts. In U.S.dollar terms, these increases were offset by the depreciation of the Rand-U.S. dollar exchangerate.
Our U.S. translated costs are very sensitive to the exchange rate of the Rand and othernon-U.S. currencies to the U.S. dollar. See Item 5. “Operating and Financial Review and Prospects— Exchange Rates”. Appreciation of the Rand and othernon-U.S. currencies against the U.S. dollar increases working costs at ouroperations when those costs are translated into U.S. dollars. See Item 3. “KeyInformation — Risk Factors — Because most of Harmony’s production costs are in Rand and othernon-U.S. currencies, while gold is generally sold in U.S. dollars, Harmony’s financial conditioncould be materially harmed by an appreciation in the value of the Rand and other non-U.S.currencies”.
The South African Rand depreciated approximately 11% against the U.S. dollar in fiscal 2008compared to fiscal 2007. In the case of our International operations, both the Australian dollarand Kina appreciated 13% and 12%, respectively, against the U.S. dollar in fiscal 2008 compared tofiscal 2007.
Reconciliation of Non-GAAP Measures
Total cash costs and total cash costs per ounce are non-GAAP measures.
Our cash costs consist primarily of production costs and are incurred to access ore to producecurrent mined reserves and are expensed as incurred. Cash costs do not include capital developmentcosts, which are incurred to allow access to the ore body for future mining operations and arecapitalized and amortized when the relevant reserves are mined.
We have calculated total cash costs and total cash costs per ounce by dividing total cashcosts, as determined using the guidance provided by the Gold Institute, by gold ounces sold for allperiods presented. Total cash costs, as defined in the guidance provided by the Gold Institute,include mine production costs, transport and refinery costs, applicable general and administrativecosts, costs associated with movements in production inventories and ore stockpiles and ongoingenvironmental rehabilitation costs as well as transfers to and from deferred stripping and costsassociated with royalties. Ongoing employee termination cost is included, however, employeetermination costs associated with major restructuring and shaft closures are excluded.
Changes in cash costs per ounce are affected by operational performance, as well as changes inthe currency exchange rate between the Rand and the U.S. dollar and, in the case of theInternational operations, the Australian dollar and Kina. Total cash costs and total cash costs perounce are non-GAAP measures. Total cash costs and total cash costs per ounce should not beconsidered by investors in isolation or as an alternative to production costs, cost of sales, orany other measure of financial performance calculated in accordance with IFRS as issued by theIASB. In addition, while the Gold Institute has provided a definition for the calculation of totalcash costs and total cash costs per ounce, the calculation of total cash costs and total cash costsper ounce may vary from company to company and may not be comparable to other similarly titledmeasures of other companies. However, we believe that cash costs per ounce is a useful indicator toinvestors and management of a mining company’s performance as it provides (1) an indication of thecash generating capacities of our mining operations, (2) the trends in cash costs as the company’soperations mature, (3) a measure of a company’sperformance, by comparison of cash costs per ounce to the spot price of gold and (4) an internalbenchmark of performance to allow for comparison against other companies.
93
The following is a reconciliation of total cash costs, as a non-GAAP measure, to the nearestcomparable GAAP measure, cost of sales under IFRS:
Continuing operations
The following is a reconciliation of total cash costs from continuing operations, as anon-GAAP measure, to the nearest comparable GAAP measure, cost of sale from continuing operations:
| | | | | | | | | | | | | |
| | | Fiscal year ended June 30, |
| | | 2008 | | 2007 | | 2006 |
| | | (in $ millions, except per ounce amounts) |
Total cost of sales from continuing operations — under IFRS | | | 1,122 | | | | 929 | | | | 909 | |
Depreciation and amortization expense | | | (117 | ) | | | (106 | ) | | | (138 | ) |
(Provision)/reversal of provision for rehabilitation costs | | | (1 | ) | | | 6 | | | | 3 | |
Care and maintenance costs of restructured shafts | | | (10 | ) | | | (8 | ) | | | (22 | ) |
Employment termination and restructuring costs | | | (29 | ) | | | — | | | | 12 | |
Share-based payments | | | (6 | ) | | | (6 | ) | | | (15 | ) |
(Impairment)/reversal of impairment of assets | | | (40 | ) | | | 19 | | | | 30 | |
Provision for post retirement benefits | | | (1 | ) | | | 2 | | | | (1 | ) |
Total cash costs from continuing operations — using Gold Institute guidance | | | 918 | | | | 836 | | | | 778 | |
Per ounce calculation: | | | | | | | | | | | | |
Ounces sold | | | 1,550,527 | | | | 1,747,071 | | | | 1,769,951 | |
Total cash cost per ounce from continuing operations — using GoldInstitute guidance | | | 591 | | | | 479 | | | | 440 | |
Discontinued operations
The following is a reconciliation of total cash costs from discontinued operations, as anon-GAAP measure, to the nearest comparable GAAP measure, cost of sales from discontinuedoperations:
| | | | | | | | | | | | | |
| | | Fiscal year ended June 30, |
| | | 2008 | | 2007 | | 2006 |
| | | (in $ millions, except per ounce amounts) |
Total cost of sales from discontinued operations — under IFRS | | | 237 | | | | 418 | | | | 300 | |
Depreciation and amortization expense | | | (7 | ) | | | (57 | ) | | | (35 | ) |
(Provision)/reversal of provision for rehabilitation costs | | | (1 | ) | | | (5 | ) | | | (1 | ) |
Care and maintenance costs of restructured shafts | | | — | | | | (1 | ) | | | (6 | ) |
Employment termination and restructuring costs | | | (4 | ) | | | — | | | | 1 | |
Share-based payments | | | — | | | | (1 | ) | | | (1 | ) |
(Impairment)/reversal of impairment of assets | | | 5 | | | | (56 | ) | | | — | |
Total cash costs from discontinued operations — using GoldInstitute guidance | | | 230 | | | | 298 | | | | 258 | |
Per ounce calculation: | | | | | | | | | | | | |
Ounces sold | | | 398,249 | | | | 587,127 | | | | 616,974 | |
Total cash cost per ounce from discontinued operations —using Gold Institute guidance | | | 576 | | | | 507 | | | | 418 | |
94
Total Harmony — Continuing and discontinued operations
| | | | | | | | | | | | | |
| | | Fiscal year ended June 30, |
| | | 2008 | | 2007 | | 2006 |
| | | (in $ millions, except per ounce amounts) |
Total production costs — under IFRS | | | 1,359 | | | | 1,347 | | | | 1,209 | |
Depreciation and amortization expense | | | (124 | ) | | | (163 | ) | | | (173 | ) |
(Provision)/reversal of provision for rehabilitation costs | | | (2 | ) | | | 1 | | | | 2 | |
Care and maintenance costs of restructured shafts | | | (10 | ) | | | (9 | ) | | | (28 | ) |
Employment termination and restructuring costs | | | (33 | ) | | | — | | | | 13 | |
Share-based payments | | | (6 | ) | | | (7 | ) | | | (16 | ) |
(Impairment)/reversal of impairment of assets | | | (35 | ) | | | (37 | ) | | | 30 | |
Provision for post retirement benefits | | | (1 | ) | | | 2 | | | | (1 | ) |
Total cash costs — using Gold Institute guidance | | | 1,148 | | | | 1,134 | | | | 1,036 | |
Per ounce calculation: | | | | | | | | | | | | |
Ounces sold | | | 1,948,776 | | | | 2,334,198 | | | | 2,386,925 | |
Total cash cost per ounce — using Gold Institute guidance | | | 589 | | | | 486 | | | | 436 | |
Within this disclosure document, our discussion and analysis is focused on the total cashcosts measure as defined by the Gold Institute.
While recognizing the importance of reducing cash costs, our chief focus is on controllingand, where possible, reducing total costs, including overhead costs. We aim to control total unitcosts per ounce produced by maintaining our low total cost structure at our existing operations. Wehave been able to reduce total costs by implementing a management structure and philosophy that isfocused on reducing management and administrative costs, implementing an ore reserve managementsystem that allows for greater grade control and acquiring higher grade reserves. See Item 4.“Information on the Company — Business — Strategy”.
Exchange Rates
Our revenues are very sensitive to the exchange rate of the Rand and other non-U.S. currenciesto the U.S. dollar.
Currently, the majority of our earnings are generated in South Africa and, as a result, mostof our costs are incurred in Rand. Since gold is generally sold in U.S. dollars, most of ourrevenues are received in U.S. dollars. The average gold price received by us during fiscal 2008increased U.S.$180 per ounce to U.S.$818 per ounce from U.S.$638 per ounce during fiscal 2007.Appreciation of the Rand against the U.S. dollar increases our U.S. dollar working costs at ourSouth African operations when those costs are translated into U.S. dollars, which serves to reduceoperating margins and net income from our South African operations. Depreciation of the Randagainst the U.S. dollar reduces these costs when they are translated into U.S. dollars, whichserves to increase operating margins and net income from our South African operations. Accordingly,strength in the Rand generally results in poorer earnings for us if there is not a similar increasein the gold price.
The exchange rates obtained when converting U.S. dollars to Rand are determined by foreignexchange markets, over which we have no control. The conversion rate for balance sheet items as atJune 30, 2008 is R7.80 per U.S.$1.00, expect for specific items within equity that are converted atthe exchange rate prevailing on the date the transaction was entered into. This compares with aconversion rate of R7.04 per U.S.$1.00 as at June 30, 2007, reflecting a depreciation of 11% of theRand against the U.S. dollar when compared with June 30, 2007. Income statement items wereconverted at the average exchange rate for the fiscal 2008 (R7.26 per U.S.$1.00), reflecting adepreciation of 1% of the Rand against the U.S. dollar when compared with fiscal 2007. The majorityof our working costs are incurred in Rands and as a result this depreciation of the Rand againstthe U.S. dollar would reduce our working costs when translated into U.S. dollars. This effect washowever negated by increases in our labor costs as well as inflationary pressures on our consumablestores and energy cost, which served to decrease operating margins and net income reflected in ourconsolidated income statement for fiscal 2008. Depreciation of the Rand against the U.S. dollarwould cause a decrease in our costs in U.S. dollar terms. Similarly, at our Internationaloperations, depreciation of the Australia dollar or Kina against the U.S. dollar would cause adecrease in our costs in U.S. dollar terms. See Item 3. “Key Information — Risk Factors — Becausemost of Harmony’s production costs are in Rand and other non-U.S. currencies, while gold isgenerallysold in U.S. dollars, Harmony’s financial condition could be materially harmed by an appreciationin the value of the Rand and other non-U.S. currencies”.
95
Inflation
Our operations have been materially impacted by inflation in recent years. At the end offiscal 2008, inflation in South Africa was 11.6%, a high level in recent years, and may risefurther. Because our costs are primarily in Rand and we generally sell our gold in U.S. dollars,movements in the Rand — U.S. dollar exchange rate may further influence the impact of inflation onour profits. To the extent the Rand depreciates against the U.S. dollar, this depreciation mayoffset the impact of inflation. The Rand depreciated approximately 11% in fiscal 2008, as comparedto a 2% strengthening in fiscal 2007 and 7% weakening in fiscal 2006.
South African Socio-Economic Environment
We are a South African company and the majority of our operations are in South Africa. As aresult, we are subject to various economic, fiscal, monetary and political policies and factorsthat affect South African companies generally. See Item 3. “Key Information — Risk Factors —Socio-economic instability in South Africa or regionally may have an adverse effect on Harmony’soperations and profits”.
South African companies are subject to significant exchange control limitations. Whileexchange controls have been relaxed in recent years, South African companies remain subject tosignificant restrictions on their ability to deploy capital outside of the Southern African CommonMonetary Area. As a result, we have historically financed our offshore acquisitions with offshorelong-term debt. See Item 10. “Additional Information — Exchange Controls”.
Social and Labor Plans, or SLPs, have been developed for each of our South African operations.These SLPs are prepared in line with legislation governing the participation of HDSAs in miningassets.
We have been granted all of our mining licenses under the MPRDA. We have therefore alreadystarted to incur expenses relating to HDSA participation. We believe the biggest challenge will liein maintaining these licenses, as we will have a responsibility in respect of human resourcedevelopment, procurement and local economic development. We are unable, however, to provide aspecific amount of what the estimated cost of compliance will be but we will continue to monitorthese costs on an ongoing basis.
Royalties
The MPRDA makes reference to royalties being payable to the South African government in termsof the Mineral and Petroleum Resources Royalty Bill which has not yet been enacted by Parliament.The fourth draft of the Mineral and Petroleum Resources Royalty Bill was tabled in Parliament onAugust 21, 2008 and provides for the payment of a royalty according to a formula based on earningsbefore interest, tax and depreciation and after the deduction of capital expenditure. This rate isthen applied to revenue to calculate the royalty amount due, with a minimum of 0,5% and a maximumof 5% for gold. It is estimated that the formula could translate to a royalty rate of more than 2%of gross sales in terms of current pricing assumptions. The latest proposal results in a largeincrease from the 1.5% rate proposed in the second draft in 2006. The royalty is to becomeeffective on May 1, 2009, if the Bill is passed by Parliament in its current form.
Costs
In order to better control our costs, we have reinstated the focus on monthly reviews toensure that stringent cost control measures are in place and enforced. This will assist us inmonitoring and reducing consumable costs.
Due to the fact that the new mines are expected to start producing high volumes of ore, due tobetter economics of scale, at higher grades, we expect that cash operating costs in dollar perounce terms will be reduced. This will be dependent on our achieving our operational plans. Thehigher grade is expected to balance the decrease in volume, ensuring that there is consistency inthe ounces produced, with an increase expected in revenue due to the increase in the gold price, asper our long term view on the various factors influencing the Rand gold price.
We reassessed our labor force and implemented several measures to reduce labor costs. Thesemeasures included terminating some contractors and offering voluntary severance packages toemployees.
Conops
For some years, mining companies have been trying to implement the concept of Conops on thebasis that it is, in theory, a better practice to utilize the company’s capital intensive, fixedassets for every day (excluding public holidays) of the year rather than for 80% of the year. Itwas estimated that Conops should result inincreased production of around 25%, with a cost increase in the region of 18%, which would lead toincreased profitability. We have been one of the few companies that had actually been able toimplement Conops, with some degree of success and with the cooperation of the labor unions.
Howeveras part of our complete review of the operations in fiscal 2008, ourExecutive Committee took along and hard look at the real benefits of Conops. In essence, we undertook a due diligence as ifwe were evaluating it for the first time. These internal due diligences were
96
conductedat theTshepong, Elandsrand, Masimong, Evander No 8 and Winkelhaak shafts, as well as at Cooke 2operations (Target is the only other shaft in the group that uses Conops).
A thorough fact-finding process was conducted within the mining, engineering (production aswell as shafts and services), human resources and financial disciplines in order to understand thereasons behind the gaps that prevented the full realisation and potential of Conops. As part of theprocess, all service functions, engineering maintenance, response time to breakdowns, weekendservice level requirements as well as commissioning and maintaining of related equipment werescrutinized.
Conops proved to be unsuitable at Masimong and was discontinued here in November 2007, withthe additional workforce being transferred to Phakisa. Action plans were drawn up by each shaftmanagement team for the remaining operations to address those issues that were identified asrequiring attention. Based on these assessments, Conops was stopped at Tsephong in January 2008,and at Elandsrand in February 2008 and Evander 2 and 5 and at Randfontein’s Cooke 1, 2 and 3operations by the end of fiscal 2008. Conops continued at Evander 8.
Productivity
The decline in productivity has been one of the challenges facing the South African goldindustry for a number of years. This decline in our productivity mainly came as a result of anaging workforce, the health of the workforce that has been negatively impacted by HIV/Aids,increased working distances from shafts and aging infrastructure. We reacted to these challengesthrough various initiatives including the “Healthy workforce” drive, the VCT campaign (voluntarytesting and counseling), upgrade of rail bound equipment and track work and other improvementprojects.
Electricity Supply
On January 24, 2008, ESKOM (the South African electricity supply body) advised us that itwould be interrupting the power supply to our South African operations. As the safety of the minerscould not be guaranteed, mining was halted for four days, after which shafts operated at between60% — 80% of capacity. A meeting between ESKOM and its industrial consumers was held on January29, 2008, whereby ESKOM committed to supplying 90% of our electricity demand prior to the shutdown. This came into effect on February 1, 2008. Management has restructured operating processes inorder to gain the most effective and efficient use of the electricity allotted. We have devised newstrategies on optimizing operations to produce at 90% of previous electricity supply to ensure thatwe deliver in line with our strategic plans.
Results of Operations
Years Ended June 30, 2008 and 2007
Continuing Operations
Revenues
Revenue increased U.S.$153 million, or 14%, from U.S.$1,116 million in fiscal 2007 toU.S.$1,269 million in fiscal 2008. This increase is attributable primarily to the higher averageprice of gold received by us, U.S.$818 per ounce in 2008 compared to U.S.$638 per ounce in 2007.This increase was partially offset by a decrease in ounces produced.
Our gold sales decreased 196,544 ounces, or 11%, from 1,747,071 in fiscal 2007 to 1,550,527 infiscal 2008. The grade recovered was lower, at 0.08 ounces per ton in fiscal 2008 compared to 0.10ounces per ton in fiscal 2007, negatively impacting on the ounces produced. The lower recoverygrade was as a result of the increase in tons treated from surface tailings dams at a lowerrecovery grade.
At Bambanani ounces produced decreased by 19%, from 189,683 in fiscal 2007 to 158,985 infiscal 2008. This was due to the restructuring of the shaft as a result of power constraints. Thiswas offset by a better recovery grade which increased from 0.154 ounces per ton in fiscal 2007 to0.174 ounces per ton in fiscal 2008.
At Doornkop ounces produced decreased from 57,364 in fiscal 2007 to 44,143 in fiscal 2008.Production volumes decreased by 103,000 tons, or 37%, primarily due to an 18 day productionstoppage to facilitate shaft work related to the South Reef project as well as three days lost dueto Eskom’s power management process.
At Elandsrand ounces produced decreased from 194,710 in fiscal 2007 to 158,631. This was dueto a decrease in volumes mainly as a result of days lost due to the accident in October 2007, aswell as a decrease in grade.
97
At Target ounces produced decreased by 40% from 142,433 in fiscal 2007 to 85,006 in fiscal2008. Production volumes decreased by 24% mainly due to issues relating to the massive stopes,which also impacted on the grade.
At Masimong ounces produced decreased by 21%, or 30,383 ounces, from 147,958 in fiscal 2007 to117,575 in fiscal 2008. This was due to a decrease in production volumes from 1,0740,000 tons to892,000 tons as a result of the restructuring process at the shaft.
The ounces produced at Kalgold increased by 66% from 56,129 in fiscal 2007 to 93,172 in fiscal2008. This was due to a 72% increase in recovery grade from 0.032 ounces per ton in fiscal 2007 to0.055 ounces per ton in fiscal 2008. This was due to the higher grade mined in the D-zone pit.
Cost of sales
Cost of sales includes production costs, depreciation and amortization, impairment of assets andemployment termination and restructuring costs.
a) Production costs
The following table sets out our total ounces sold and weighted average cash costs per ouncefor fiscal 2008 and fiscal 2007:
| | | | | | | | | | | | | | | | | | | | | |
| | | | | | | | | | | | | | | | | | | Percentage |
| | | Year Ended June 30, | | Year Ended June 30, | | Increase |
| | | 2008 | | 2007 | | in Cash |
| | | (oz) | | ($/oz) | | (oz) | | ($/oz) | | Costs per ounce |
SOUTH AFRICA | | | | | | | | | | | | | | | | | | | | |
Tshepong | | | 273,119 | | | | 457 | | | | 318,887 | | | | 351 | | | | 30 | |
Phakisa | | | 4,212 | | | | 558 | | | | — | | | | — | | | | — | |
Bambanani | | | 158,985 | | | | 641 | | | | 197,060 | | | | 586 | | | | 9 | |
Doornkop | | | 44,143 | | | | 703 | | | | 57,364 | | | | 439 | | | | 60 | |
Elandsrand | | | 158,631 | | | | 652 | | | | 194,710 | | | | 527 | | | | 24 | |
Target | | | 85,006 | | | | 605 | | | | 142,433 | | | | 370 | | | | 64 | |
Masimong | | | 117,575 | | | | 745 | | | | 147,958 | | | | 559 | | | | 33 | |
Evander operations | | | 240,037 | | | | 525 | | | | 235,443 | | | | 481 | | | | 9 | |
Virginia operations | | | 250,324 | | | | 719 | | | | 266,948 | | | | 546 | | | | 32 | |
Other — underground | | | 69,574 | | | | 744 | | | | 104,507 | | | | 488 | | | | 52 | |
Other — surface | | | 148,921 | | | | 390 | | | | 81,761 | | | | 428 | | | | (9 | ) |
| | | | | | | | | | | | | | | | | | | | |
INTERNATIONAL | | | | | | | | | | | | | | | | | | | | |
PNG | | | — | | | | — | | | | — | | | | — | | | | — | |
Total continuing operations | | | 1,550,527 | | | | | | | | 1,747,071 | | | | | | | | | |
Weighted average | | | | | | | 591 | | | | | | | | 479 | | | | 23 | |
Our average cash costs from continuing operations increased by U.S.$112 per ounce, or 23%,from U.S.$479 per ounce in fiscal 2007 to U.S.$591 per ounce in fiscal 2008. Cash costs per ouncevary with the working costs per ton (which is, in turn, affected by the number of tons processed)and grade of ore processed. Cash costs expressed in U.S. dollars per ounce also vary withfluctuations in the Rand-U.S. dollar exchange rate, because most of our working costs are incurredin Rand. The increase in cash cost expressed in U.S. dollars per ounce in fiscal 2008 wasattributable primarily to an increase in operating cost as well as the decrease in ounces producedwhen compared to fiscal 2007. Annual increases in labor cost as well as inflationary pressures onour consumable stores and energy costs were the main contributors towards a higher operating cost.
At Tshepong, the cash costs increased from U.S.$351 in fiscal 2007 to U.S.$457, or 30%, infiscal 2008. This was due to the decrease in ounces produced in fiscal 2008 as well an increase of11% related to increases in labor and supply costs.
At Doornkop, the cash costs increased by 60%, from U.S.$439 in fiscal 2007 to U.S.$703 infiscal 2008, primarily due to lower production volumes and industry-wide cost increases.
98
At Target, the cash costs increased from U.S.$370 in fiscal 2007 to U.S.$605 in fiscal 2008,or by 64%, primarily due to lower recovery grades and volumes resulting from issues experiencedduring fiscal 2008.
At Masimong, the cash costs increased by 33% from U.S.$559 in fiscal 2007 to U.S.$745 infiscal 2008, primarily due to the restructuring and cessation of Conops, as well as a decrease inounces produced.
Under Other — Underground, the cash costs at Joel increased from U.S.$418 in fiscal 2007 toU.S.$639 in fiscal 2008, or 53%. This was due to the decrease in tonnage after re-equippingresulted in the shaft not being fully operational for the first six months of fiscal 2008. Costswere also 17% higher in fiscal 2008. Also, at St. Helena, cash costs increased by 81% from U.S.$840per ounce in fiscal 2007 to U.S.$1,523 per ounce in fiscal 2008. This was due to the fact that theshaft was closed during fiscal 2008.
Under Other — Surface, the cash costs at Kalgold decreased by 15% from U.S.$485 in fiscal2007 to U.S.$411 in fiscal 2008, primarily due to the increase in ounces produced. This was offsetby an increase of 30% at Phoenix, from U.S.$293 to U.S.$381, as a result of a decrease in grade andan increase in volumes and transport costs
b) Depreciation and amortization
Depreciation and amortization increased to U.S.$117 million in fiscal 2008, from U.S.$106million in fiscal 2007. This increase relates primarily to the increase in depreciation onnon-mining assets (U.S.$4 million) and borrowings’ issue costs (U.S.$3 million). The commencementof depreciation on the two completed levels on the Elandsrand New Mine during July 2007 resulted ina depreciation charge of U.S.$2 million. These increases offset the decrease resulting from adecrease in production.
c) Employment termination and restructuring costs
The charge for employment termination and restructuring costs increased from U.S.$nil infiscal 2007 to U.S.$29 million in fiscal 2008. The charge in fiscal 2008 relates to the voluntaryretrenchment process that was initiated in December 2007 when management decided to decentralizecentral services and the cessation of Conops at several of the operations. By the end of fiscal2008, the process had been completed.
d) Impairment of assets
The impairment charge increased from a credit of U.S.$19 million in fiscal 2007 to a charge ofU.S.$40 million in fiscal 2008. The charge in fiscal 2008 relates to impairments at the Evander andother underground operations as well as surface operations (Kalgold). Included in the amount isU.S.$13 million for goodwill related to certain shafts that were included under “Other —Underground”. These impairments resulted primarily from a decrease in the expected life of mine ofthese operations, as well as an increase in the costs to operate the shafts. These changes resultedin the carrying amount exceeding the recoverable amount. The credit in fiscal 2007 resulted fromreversals at surface operations (Kalgold) and other underground operations. This was offset by acharge of U.S.$2 million relating to the cessation of operations at the Refinery in the Free State.
Other expenses/income
Charges for other expenses increased to U.S.$15 million, compared with a credit of U.S.$25million in fiscal 2007. This was primarily due to the decrease of profit on disposal of property,plant and equipment from U.S.$25 million in fiscal 2007 to U.S.$nil in fiscal 2008. Alsocontributing was the increase in provision for bad debts from U.S.$1 million in fiscal 2007 toU.S.$14 million in fiscal 2008. This provision relates to trade and loans receivables that haveexceeded their payment terms, and where we believe that recoverability is doubtful.
These charges were offset by the increase of U.S.$15 million in foreign exchange gains relatedto the loans to the International operations. These loans, which was previously designated as netinvestments of the Group’s International operations, were de-designated in fiscal 2008, mainly as aresult of the expected proceeds from the PNG Partnership Agreement (see “Recent Developments”).Accumulated exchange gains/(losses) that arose while the loans were considered to form part of theGroup’s net investment in its International operations will be reclassified to the consolidatedincome statement as and when the loans are repaid.
Loss from associates
The loss from associates increased from U.S.$3 million in fiscal 2007 to U.S.$11 million infiscal 2008. The increase relates primarily to inclusion of losses from Pamodzi from sinceacquisition on February 27, 2008.
Profit on sale of investment in associate
The profit on sale of investment in associate decreased to U.S.$nil in fiscal 2008 fromU.S.$33 million in fiscal 2007. The amount in 2007 was as a result of the disposal of our interestin Western Areas in exchange for Gold Fields shares.
99
Impairment of investment in associate
The charge relating the impairment of investment in associate increased from U.S.$nil infiscal 2007 to U.S.$12 million in fiscal 2008. The amount in fiscal 2008 relates primarily to theimpairment of the investment in Pamodzi. The recoverable amount was determined with reference tothe market value of the listed shares, which would be the amount we would receive on disposal ofthe shares. As the carrying value exceeded the recoverable amount, the investment was impaired downto this amount.
Fair value of non-derivative financial instruments
The gains in fiscal years 2007 and 2008 are related to the investment in ARM held by the ARMEmpowerment Trust, where the increase in the share value of the ARM shares above R29 (U.S.$4.62)per share is limited to the interest capitalized on the Nedbank loan.
Loss on sale of listed investments
The loss on sale of listed investments increased from U.S.$5 million in fiscal 2007 to U.S.$63million in fiscal 2008. The amount in 2008 relates to the sale of the remainder of the investmentin Gold Fields. The loss in fiscal 2007 arose when we disposed of a portion of our interest in GoldFields through various transactions.
Investment income
Investment income increased from U.S.$27 million in fiscal 2007 to U.S.$39 million in fiscal2008, primarily to the increase in interest received on loans (U.S.$4 million) and held-to-maturityinvestments, being our environmental trust funds (U.S.$4 million). Also contributing was anincrease in dividends received from U.S.$3 million in fiscal 2007 to U.S.$5 million in fiscal 2008,which related to the Gold Fields shares.
Finance costs
Finance costs increased from U.S.$65 million in fiscal 2007 to U.S.$70 million in fiscal 2008.This was due primarily to the increase in interest rates as well as the increase in the balance ofthe outstanding debt. This was offset by the increase in interest capitalized to qualifying assets,from U.S.$10 million in fiscal 2007 to U.S.$22 million in fiscal 2008. See “Recent AccountingPronouncements” for a discussion on the early-adoption of IAS 23 (Revised) — Borrowing Costs.
Income and Mining Taxes
South Africa. We pay taxes on mining income and non-mining income. The amount of our SouthAfrican mining income tax is calculated on the basis of a formula that takes into account our totalrevenue and profits from, and capital expenditures for, mining operations in South Africa. 5% oftotal mining revenue is exempt from taxation in South Africa as a result of the application of theapplicable gold mine formula. The amount of revenue subject to taxation is calculated by deductingqualifying capital expenditures from taxable mining income. The amount by which the taxable miningincome exceeds 5% of mining revenue constitutes taxable mining income. We and our subsidiaries eachmake our own calculation of taxable income.
The tax rate applicable to the mining and non-mining income of a gold mining company dependson whether the company has elected to be exempt from the Secondary Tax on Companies, (“STC”). TheSTC is a tax on dividends declared and, at present, the STC tax rate is equal to 10% (previously12,5%). To the extent we receive dividends, such dividends received are offset against the amountof dividends paid for purposes of calculating the amount subject to STC. In 1993, all existingSouth African gold mining companies had the option to elect to be exempt from STC. If the electionwas made, a higher tax rate would apply for both mining and non-mining taxable income. In 2008, thetax rates for companies that elected the STC exemption were 43% for mining income and 35% fornon-mining income, compared with 34% for mining income and 28% for non-mining income if the STCexemption election was not made. In 2007, the tax rates for companies that elected the STCexemption were 45% for mining income and 37% for non-mining income, compared with 35% for miningincome and 29% for non-mining income if the STC exemption election was not made. In 1993, weelected to pay the STC tax. All of our South African subsidiaries, excluding Avgold, elected theSTC exemption.
| | | | | | | | | |
| Income and Mining Tax | | 2008 | | 2007 |
Effective tax rate (expense)/benefit | | | 172 | % | | | (25 | )% |
The effective tax rate for fiscal 2008 was higher than the statutory tax rate of 43% for usand our subsidiaries as a whole. The most
100
significant reasons for the increase in the effective taxrate in fiscal 2008 relates to non-deductible expenses and prior year adjustments. Offsetting thisis the difference between the SA mining statutory tax rate and the rate used to provide deferredtax and other tax dispensations granted on certain mining assets. Included in the non-deductibleexpenses is the impairment on investment in associate (U.S.$11 million) and loss on sale ofinvestments (U.S.$63 million).
PNG. We are in the process of developing the Hidden Valley Project in PNG. We are alsoreviewing other potential projects and carrying out extensive exploration.
PNG mining projects are taxed on a project basis. Therefore each project is taxed as aseparate entity, even though it may be one of a number of projects carried on by the same company.In certain circumstances there is an ability to transfer the tax benefit obtained throughexploration expenditure between projects and wholly owned companies. Tax losses are generallyquarantined and cannot be transferred between projects.
PNG mining companies are taxed at a rate of tax of 30%.
Capital development and exploration expenditure incurred in PNG is capitalized for taxpurposes and can be generally deducted at 25% per annum on a diminishing value basis againstproject income.
PNG imposes dividend withholding tax of 10% on dividends paid by PNG mining operations to nonresidents. Although PNG also imposes interest withholding tax on interest off shore, PNG miningoperations may qualify for an exemption.
Discontinued Operations
Revenues
Revenues decreased from U.S.$372 million in fiscal 2007 to U.S.$312 million in fiscal 2008,due to the fact that South Kalgoorlie and Orkney operations were sold in December 2007 and February2008, respectively, as well as Mt Magnet being placed on care and maintenance. Also contributing islower ounces produced at the Cooke operations. These decreases were offset by an increase in theaverage gold price received.
Costs
Costs decreased from U.S.$374 million in fiscal 2007 to U.S.$236 million in fiscal 2008. Thiswas due to the sale of South Kalgoorlie and Orkney operations during fiscal 2008. Also contributingis the decrease in the depreciation and amortization charge from U.S.$57 million in fiscal 2007 toU.S.$7 million in fiscal 2008. This was due to the cessation of charging depreciation on assetsclassified as held for sale. The profit on sale of the South Kalgoorlie and Orkney operationsamounted to a credit of U.S.$13 million.
Impairment of assets
The impairment of assets charge decreased from a charge of U.S.$56 million in fiscal 2007 to acredit of U.S.$5 million in fiscal 2008. These amounts in fiscal 2007 and 2008 relate toadjustments to the carrying value of Australian operations’ assets when they were classified asheld for sale and subsequent reporting dates.
Income and Mining Taxes
South Africa. We pay taxes on mining income and non-mining income. For details, refer to thediscussion under “Income and Mining Taxes” in the Continuing Operations section.
In 2008, the tax rates for companies that elected the STC exemption were 43% for mining incomeand 35% for non-mining income, compared with 34% for mining income and 28% for non-mining income ifthe STC exemption election was not made. In 2007, the tax rates for companies that elected the STCexemption were 45% for mining income and 37% for non-mining income, compared with 35% for miningincome and 29% for non-mining income if the STC exemption election was not made.
Australia. Generally, Australia imposes tax on the worldwide income (including capital gains)of all of our Australian incorporated and tax resident entities. The current income tax rate forcompanies is 30%. Ongoing business, mining, exploration and rehabilitation costs incurred each yearare fully deductible. The cost of plant and capital mining expenditure may be depreciated anddeducted over its effective life.
The Australian legislature has introduced a Tax Consolidations Regime, under which from July1, 2003, Harmony Gold Australia Proprietary Limited and its wholly owned Australian subsidiarycompanies are recognised and taxed as a single entity. Under the consolidations rules all of theAustralian subsidiary companies are treated as divisions of Harmony Gold Australia. As a result allinter company transactions between group members are ignored for tax purposes. This allows thegroup to transfer assets between group members without any tax consequences, and to utilize all taxlosses incurred by each company in the group.
101
Mining operations (other than operations on freehold land) are also subject to a 2.5% goldroyalty because the mineral rights are owned by the state. All gold production from the Mt. Magnetoperations is subject to this royalty. Most of the production from the South Kalgoorlie operationsis from freehold land and is, accordingly, exempt from this royalty.
Withholding tax is payable on dividends, interest and royalties paid by Australian residentsto non-residents, which would include any dividends on the shares of our Australian subsidiariesthat are paid to us. In the case of dividend payments to non-residents, a 30% withholding taxapplies. However, where the recipient of the dividend is a resident of a country with whichAustralia has concluded a double taxation agreement, the rate of withholding tax is generallylimited to 15% (or 10% where the dividend is paid to a company’s parent company). Where dividendsare fully franked, an effective credit is allowed against any withholding tax otherwise payable,regardless of whether a double taxation agreement is in place.
Continuing and discontinued operations
Net (loss)/profit
The net (loss)/profit decreased from a net profit of U.S.$51 million in fiscal 2007 to a net lossof U.S.$30 million. This is due to the factors discussed above.
Years Ended June 30, 2007 and 2006
Continuing Operations
Revenues
Revenue increased U.S.$179 million, or 19%, from U.S.$937 million in fiscal 2006 to U.S.$1,116million in fiscal 2007. This increase is attributable primarily to the slightly higher averageprice of gold received by us, U.S.$638 per ounce in 2007 compared to U.S.$529 per ounce in fiscal2006. Also contributing to the increase was an increase in ounces produced.
Our gold sales decreased 22,880 ounces, or 1%, from 1,769,951 in fiscal 2006 to 1,747,071 infiscal 2007. The grade recovered was lower, at 0.11 ounces per ton in fiscal 2007 compared to 0.12ounces per ton in fiscal 2006, negatively impacting on the ounces produced.
At Doornkop ounces produced increased by 31,6% from 43,593 in fiscal 2006 to 57,364 in fiscal2007. This was mainly due to an increase in production volumes. Volumes increased, mainly as aresult of flexibility created during the year by increasing development of the orebody.
At Elandsrand ounces produced increased from 170,867 in fiscal 2006 to 194,710 in fiscal 2007.This can primarily be attributed to an increase in production volumes.
At the Evander operations, ounces produced decreased by 14% to 235,443 ounces in fiscal 2007from 274,439 ounces in fiscal 2006. This was primarily attributable to lower tons milled fromEvander 5 as well as a lower recovery grade from Evander 7. Tons milled for Evander 5 decreasedfrom 450,000 in fiscal 2006 to 377,000 in fiscal 2007. The decrease in tons milled was mainly dueto the depletion of the open raise lines on 24 level and 80% of the mining was done in pillars. Therecovery grade at Evander 7 dropped from 0.191 in fiscal 2006 to 0.137 in fiscal 2007. Ouncesproduced for Evander 7 decreased by 26.6% from 83,202 in fiscal 2006 to 61,044 in fiscal 2007. Thegrade decrease at Evander 7 was mainly due to the depletion of a very high grade pay shoot in theNo.3 decline area as well as an increase in mining in the upper area of the shaft (pillar area)that was of lower grade.
Under Other—Underground, ounces produced at Joel increased by 36,4% from 58,595 in fiscal2006 to 79,923 in fiscal 2007. The increase in ounces produced was due to an increase in tonsmilled as well as an increase in recovered grade. The increase in tons milled was primarilyattributable to the commissioning of the midshaft loading arrangement on 137 level, which wascommissioned on February 28, 2006.
Under Other — Surface, ounces produced at Kalgold decreased from 77,071 in fiscal 2006 to56,129 in fiscal 2007. Tons milled decreased from 2,008,000 in fiscal 2006 to 1,740,000 in fiscal2007. These decreases were due to lower throughput into the plant due to a water shortageencountered in March 2007.
Cost of sales
Cost of sales includes production costs, depreciation and amortization, impairment of assetsand employment termination and restructuring costs.
102
a) Production costs
The following table sets out our total ounces sold and weighted average cash costs per ouncefor fiscal 2007 and fiscal 2006:
| | | | | | | | | | | | | | | | | | | | | |
| | | | | | | | | | | | | | | | | | | Percentage |
| | | Year Ended June 30, | | Year Ended June 30, | | Increase |
| | | 2007 | | 2006 | | in Cash |
| | | (oz) | | ($/oz) | | (oz) | | ($/oz) | | Costs per ounce |
SOUTH AFRICA | | | | | | | | | | | | | | | | | | | | |
Tshepong | | | 318,887 | | | | 351 | | | | 335,289 | | | | 335 | | | | 5 | |
Phakisa | | | — | | | | — | | | | — | | | | — | | | | — | |
Bambanani | | | 197,06 | | | | 586 | | | | 200,739 | | | | 502 | | | | 17 | |
Doornkop | | | 57,364 | | | | 439 | | | | 43,593 | | | | 558 | | | | (21 | ) |
Elandsrand | | | 194,710 | | | | 527 | | | | 170,867 | | | | 523 | | | | 1 | |
Target | | | 142,433 | | | | 370 | | | | 150,196 | | | | 346 | | | | 7 | |
Masimong | | | 147,958 | | | | 559 | | | | 136,153 | | | | 489 | | | | 14 | |
Evander operations | | | 235,443 | | | | 481 | | | | 274,439 | | | | 403 | | | | 19 | |
Virginia operations | | | 266,948 | | | | 546 | | | | 276,285 | | | | 488 | | | | 12 | |
Other — Underground | | | 104,507 | | | | 488 | | | | 77,652 | | | | 541 | | | | (8 | ) |
Other — Surface | | | 81,761 | | | | 428 | | | | 104,738 | | | | 439 | | | | (3 | ) |
| | | | | | | | | | | | | | | | | | | | |
INTERNATIONAL | | | | | | | | | | | | | | | | | | | | |
PNG | | | — | | | | — | | | | — | | | | — | | | | — | |
Total continuing operations | | | 1,747,071 | | | | | | | | 1,769,951 | | | | | | | | | |
Weighted average | | | | | | | 479 | | | | | | | | 440 | | | | 9 | |
Ourweighted average cash costs from continuing operations increased byU.S.$39 per ounce, or9%, from U.S.$440 per ounce in fiscal 2006 to U.S.$479 per ounce in fiscal 2007. Cash costs perounce vary with the working costs per ton (which is, in turn, affected by the number of tonsprocessed) and grade of ore processed. Cash costs expressed in U.S. dollars per ounce also varywith fluctuations in the Rand-U.S. dollar exchange rate, because most of our working costs areincurred in Rand. The increase in cash cost expressed in U.S. dollars per ounce in fiscal 2007 wasattributable primarily to an increase in operating cost as the ounces produced remained almostunchanged when compared to fiscal 2006. Annual increases in labor cost as well as inflationarypressures on our consumable stores and energy costs were the main contributors towards a higheroperating cost.
At Bambanani, cash costs increased from U.S.$502 per ounce in fiscal 2006 to U.S.$586 perounce in fiscal 2007, primarily as a result of higher labor costs as well as a lower recovery gradedue to underground fires during fiscal 2007.
At Doornkop, cash costs decreased from U.S.$558 per ounce in fiscal 2006 to U.S.$439 per ouncein fiscal 2007. This increase was primarily attributable to the increase in production levels atDoornkop.
Cash costs at Target increased from U.S.$346 per ounce in fiscal 2006 to U.S.$370 per ounce infiscal 2007. This resulted mainly from a lower recovery grade as well as an increase in cash costsdue to higher production levels and labor costs.
At Masimong, cash costs increased by 15% from U.S. U.S.$489 per ounce in fiscal 2006 toU.S.$559 per ounce in fiscal 2007. This was due to higher labor costs as a result of theimplementation of Conops.
Cash costs at Evander operations increased by 19% from U.S.$403 per ounce in fiscal 2006 toU.S.$481 per ounce in fiscal 2007. The decrease ca primarily be attributed to lower recovery gradesat Evander 7 and 8 shafts, grade dropped by 28% and 11% respectively.
At our Virginia operations, cash costs increased by 12% from U.S.$488 per ounce in fiscal 2006to U.S.$546 per ounce in fiscal 2007. The increase was due to a combination of higher total cost aswell as lower recovery grade. Total cost increased by 9% from U.S.$135 million in fiscal 2006 toU.S.$147 million in fiscal 2007. The recovery dropped by 9% during fiscal 2007, this was partlyattributable to the production at Harmony 2. Production at Harmony 2 was hampered by a fire in thehigh grade basal pillar.
103
Under Other — Underground, cash costs at Joel decreased from U.S.$498 per ounce in fiscal2006 to U.S.$418 per ounce in fiscal 2007. This decrease was primarily attributable to higherproduction as well as an improved recovery grade.
b) Depreciation and Amortization
Depreciationand amortization charges decreased U.S.$32 million, or 23%, from U.S.$138 millionin fiscal 2006 to U.S.$106 million in fiscal 2007. This resulted mainly from decreased production.
c) Care and Maintenance Cost of Restructured Shafts
The charge for the care and maintenance cost of restructured shafts decreased from U.S.$22million in fiscal 2006 to U.S.$8 million in fiscal 2007. This resulted from lower labor costsrelating to the termination of non-productive employees.
d) Employment Termination Costs
No charge was recorded for employment termination costs in fiscal 2007, a decrease from acredit of U.S.$12 million in fiscal 2006. During fiscal 2006, we continued with the process of afinal restructuring process in the Free State region. This process was announced in fiscal 2005.This affected the Free State, Freegold, ARMgold and Avgold operations.
e) Impairment of Assets
Impairment charges decreased from a net reversal of U.S.$30 million in fiscal 2006 to a netreversal of U.S.$19 million in fiscal 2007. The amount in fiscal 2007 includes a U.S.$21 millionreversal of impairment related to the reversal at our surface operations (Kalgold) and otherunderground operations. Offsetting this credit, is a impairment recorded at the Free StateRefinery, which is no longer in operation and the carrying value has been written down to U.S.$nil.These reversals and impairments resulted from changes in the expected life of mines and operations.The increase in gold price would have a positive impact on the recoverable amount, where anincrease in costs would have a negative one. Where the recoverable amount, exceeded the carryingvalue, the impairments previously recognized where reversed. Where the carrying amount exceeded therecoverable amount, the asset was impaired down to the recoverable amount. The amount for fiscal2006 includes reversal of impairments at our Free State, Evander, Bambanani and other undergroundoperations. Offsetting this is an amount of U.S.$16.0 million for the impairment recorded atLydenburg Exploration Limited on amounts previously capitalized as undeveloped properties for whichno future financial benefits are expected by management.
Exploration expenditure
Exploration expenditure increased from U.S.$11 million in fiscal 2006 to U.S.$27 million infiscal 2007, primarily due to increased exploration activity in PNG (Wafi and Hidden Valley areas).
Other expenses — net
Other expenses increased from a charge of U.S.$97 million in fiscal 2006 to a credit ofU.S.$25 million in fiscal 2007. Profit on sale of property, plant and equipment increased U.S.$15million from U.S.$10 million in fiscal 2006 to U.S.$25 million in fiscal 2007. This was primarilydue to the profit on the sale of Randfontein 4 shaft and the Deelkraal surface assets, resulting inprofits of U.S.$10 million and U.S.$14 million respectively. Also contributing is the decrease inlosses on financial instruments from a charge of U.S.$81 million in fiscal 2006 to a credit ofU.S.$6 million in fiscal 2007.
Loss from Associates
Loss from associates was U.S.$3 million in fiscal 2007, compared to U.S.$17 million in fiscal2006. The amount in fiscal 2007 relates to our attributable share of losses in Western Areas forthe six months from July 1, 2006 to December 8, 2006. The amount in fiscal 2006 relates to our29.2% attributable share of losses in Western Areas for the three months from March 9, 2006 untilJune 30, 2006.
Profit on Sale of Investment in Associate
A profit of U.S.$33 million was recognized in fiscal 2007 (U.S.$nil in fiscal 2006). This was as aresult of the disposal of our interest in Western Areas in exchange for Gold Fields shares.
(Loss)/Profit on Sale of Listed Investments
We recorded a loss of U.S.$5 million in fiscal 2007 as compared with a profit of U.S.$45million on the sale of listed investments in fiscal 2006. The loss in fiscal 2007 arose when wedisposed of a portion of our interest in Gold Fields through various transactions.
104
In fiscal 2006, we disposed of our remaining investment in Gold Fields for U.S.$362 millionacquired in prior years. The process was concluded through market disposals which commenced onNovember 10, 2005 and an open market offering on November 15 and 16, 2005. The investment wasacquired at a cost of U.S.$316 million, resulting in a gain of U.S.$45 million.
Investment Income
Investment income decreased from U.S.$31 million in fiscal 2006 to U.S.$27 million in fiscal2007. This is due to interest received decreasing from U.S.$29 million in fiscal 2006 to U.S.$24.million in fiscal 2007. This decrease was attributable primarily to the decrease in interest earnedon bank and call accounts due to lower average balances through the year. This was partially offsetby an increase in South African interest rates.
Finance costs
Finance costs were U.S.$65 million in fiscal 2007 compared to U.S.$62 million during fiscal2006. This decrease was due to the lower average interest bearing debt balance during the year,primarily as a result of the redemption of the senior uncollateralized fixed rate bonds during June2006 as well as the capitalization of interest for qualifying assets under construction. Thisdecrease was offset primarily by an increase in interest paid on the U.S.$140 million RMB loanraised to finance the acquisition of the stake in Western Areas in March 2006.
Income and Mining Taxes
South Africa. We pay taxes on mining income and non-mining income. The amount of our SouthAfrican mining income tax is calculated on the basis of a formula that takes into account our totalrevenue and profits from, and capital expenditures for, mining operations in South Africa. 5% oftotal mining revenue is exempt from taxation in South Africa as a result of the application of theapplicable gold mine formula. The amount of revenue subject to taxation is calculated by deductingqualifying capital expenditures from taxable mining income. The amount by which the taxable miningincome exceeds 5% of mining revenue constitutes taxable mining income. We and our subsidiaries eachmake our own calculation of taxable income.
The tax rate applicable to the mining and non-mining income of a gold mining company dependson whether the company has elected to be exempt from the Secondary Tax on Companies, or STC. TheSTC is a tax on dividends declared and, at present, the STC tax rate is equal to 10% (previously12.5%). To the extent we receive dividends, such dividends received are offset against the amountof dividends paid for purposes of calculating the amount subject to STC. In 1993, all existingSouth African gold mining companies had the option to elect to be exempt from STC. If the electionwas made, a higher tax rate would apply for both mining and non-mining taxable income. In 2007, thetax rates for companies that elected the STC exemption were 45% for mining income and 37% fornon-mining income, compared with 35% for mining income and 29% for non-mining income if the STCexemption election was not made. In 2006, the tax rates were the same to that in 2007. In 1993, weelected to pay the STC tax. All of our South African subsidiaries, excluding Avgold, elected theSTC exemption.
| | | | | | | | | |
| Income and Mining Tax | | 2007 | | 2006 |
Effective tax rate (expense)/benefit | | | (25 | )% | | | 24 | % |
The effective tax rate for fiscal 2007 was lower than the statutory tax rate of 45% for us andour subsidiaries as a whole. The most significant reason for the decrease in the effective tax ratein fiscal 2007 relates to the non taxable income received by way of the profit realized on thedisposal of the investment held in Western Areas. Offsetting this amount is an increase in thedifference between the South African mining formula tax rate and the maximum mining statutory rateon mining income. Contributing to the tax expense for fiscal 2007 are non-deductible expenses ofU.S.$8 million.
PNG. We are in the process of developing the Hidden Valley Project in PNG. We are alsoreviewing other potential projects and carrying out extensive exploration.
PNG mining projects are taxed on a project basis. Therefore each project is taxed as aseparate entity, even though it may be one of a number of projects carried on by the same company.In certain circumstances there is an ability to transfer the tax benefit obtained throughexploration expenditure between projects and wholly owned companies. Tax losses are generallyquarantined and cannot be transferred between projects.
PNG mining companies are taxed at a rate of tax of 30%.
105
Capital development and exploration expenditure incurred in PNG is capitalised for taxpurposes and can be generally deducted at 25% per annum on a diminishing value basis againstproject income.
PNG imposes dividend withholding tax of 10% on dividends paid by PNG mining operations to nonresidents. Although PNG also imposes interest withholding tax on interest off shore, PNG miningoperations may qualify for an exemption.
Discontinued operations
Revenue
Revenue increased by U.S.$45 million in fiscal 2007 from U.S.$327 million in fiscal 2006 toU.S.$372 million as a result of a higher average gold price received.
Costs
Costs decreased in fiscal 2007 from U.S.$185.3 million in fiscal 2007 to U.S.$148.4 million. Thiswas primarily due to the decrease in losses from derivative instruments from U.S.$78.8 million infiscal 2006 to U.S.$4.6 million in fiscal 2007. This was offset by an increase of U.S.$19.5 millionin the depreciation charge in fiscal 2007 due to a reduction in reserves as well as an increase incash operating cost of U.S.$17.5 million.
Impairment of assets
During fiscal 2007, an impairment of assets (U.S.$56 million) was recorded on the Australianoperations on classification as held for sale.
Taxation
South Africa. We pay taxes on mining income and non-mining income. For a discussion on thedetail, see “Income and mining taxation” under the Continuing Operations section.
In 2007, the tax rates for companies that elected the STC exemption were 45% for mining incomeand 37% for non-mining income, compared with 35% for mining income and 29% for non-mining income ifthe STC exemption election was not made. In 2006, the tax rates were the same to that in 2007. In1993, we elected to pay the STC tax. All of our South African subsidiaries, excluding Avgold,elected the STC exemption.
Australia. Generally, Australia imposes tax on the worldwide income (including capital gains)of all of our Australian incorporated and tax resident entities. The current income tax rate forcompanies is 30%. Ongoing business, mining, exploration and rehabilitation costs incurred each yearare fully deductible. The cost of plant and capital mining expenditure may be depreciated anddeducted over its effective life.
The Australian legislature has introduced a Tax Consolidations Regime, under which from July1, 2003, Harmony Gold Australia Proprietary Limited and its wholly owned Australian subsidiarycompanies are recognised and taxed as a single entity. Under the consolidations rules all of theAustralian subsidiary companies are treated as divisions of Harmony Gold Australia. As a result allinter company transactions between group members are ignored for tax purposes. This allows thegroup to transfer assets between group members without any tax consequences, and to utilize all taxlosses incurred by each company in the group.
Mining operations (other than operations on freehold land) are also subject to a 2.5% goldroyalty because the mineral rights are owned by the state. All gold production from the Mt. Magnetoperations is subject to this royalty. Most of the production from the South Kalgoorlie operationsis from freehold land and is, accordingly, exempt from this royalty.
Withholding tax is payable on dividends, interest and royalties paid by Australian residentsto non-residents, which would include any dividends on the shares of our Australian subsidiariespaid to us. In the case of dividend payments to non-residents, a 30% withholding tax applies.However, where the recipient of the dividend is a resident of a country with which Australia hasconcluded a double taxation agreement, the rate of withholding tax is generally limited to 15% (or10% where the dividend is paid to a company’s parentcompany). Where dividends are fully franked, an effective credit is allowed against any withholdingtax otherwise payable, regardless of whether a double taxation agreement is in place.
Continuing and discontinued operations
Net Profit/(Loss)
Net profit was U.S.$51 million in fiscal 2007 compared with the loss of U.S.$91 million infiscal 2006. This decrease is attributed primarily to the factors described above.
106
Recent Accounting Pronouncements
In April 2007, the IASB issued IFRS 3 (Revised) — Business Combinations and IAS 27 (Amended) —Consolidated and Separate Financial Statements, effective for the annual periods commencing afterJuly 1, 2009. The changes made to IFRS 3 and IAS 27 have the following effects: ( a) Partialacquisitions on non-controlling interest are measured either as their proportionate interest in thenet identifiable assets or at fair value; (b) Goodwill is measured as the difference at acquisitiondate between the fair value of any investment in the business held before the acquisition, theconsideration transferred and the net assets acquired for step acquisitions; (c )Acquisition-related costs are generally recognised as expenses instead of included in goodwill; (d)Contingent consideration must be recognised and measured at fair value at the acquisition date.Subsequent changes in fair value are recognised in accordance with other IFRSs, usually in profitand loss, rather than adjusting goodwill; (e) for transactions with non-controlling interests, thechanges in a parent’s ownership in a subsidiary that do not result in the loss of control areaccounted for as equity transactions. The effect of the revised IFRS 3 and amended IAS 27 will berecorded in future periods when such transactions are entered into.
In June 2007, the International Financial Reporting Interpretation Committee (“IFRIC”) issuedinterpretation 14 — IAS 19 , The Limit on a Defined Asset Minimum Funding Requirements and theirInteraction. IFRIC 14 addresses three issues: (a) how to determine the limit placed by IAS 19Employee Benefits on the amount of a surplus in a pension plan they can recognise an asset; (b) howa minimum funding requirement affects that limit; ( c) and when the minimum funding requirementcreates an onerous obligation that should be recognised as a liability in addition to thatotherwise recognised under IAS 19. IFRIC 14 requires that an asset be recognised in relation to thesurplus on a consistent basis; and where there is both a strong minimum funding requirement andrestrictions over the amount, an entity can recover from the plan, either as refunds or a reductionin contribution; entities have to recognise an additional liability. The interpretation iseffective for annual periods commencing on or after January 1, 2008. IFRIC 14 will not affect ourannual report as we only have defined contributions pension plans.
In September 2007, the IASB issued IAS 1 (Revised) — Presentation of Financial Statements.The statement was issued with the aim to aggregate information in the financial statements on abasis of common characteristics, which resulted in the changes in equity to be presented separatelybetween those changes resulting from transactions with equity participants (owners), in theircapacity as owners, and those other non-owner equity transactions. The revised standard allows fora statement of other comprehensive income, with the net income recognized directly in equity nowbeing moved to the statement of other comprehensive income, with the statement of changes in equityreflecting a line item, total comprehensive income. The change is effective for annual periodscommencing on or after January 1, 2009. We have early adopted the disclosure requirements of IAS 1,effective for the year ending June 30, 2008.
In November 2007, the IASB issued IFRS 8 — Operating Segments. The statement was issued withthe aim to achieve convergence in accounting standards around the world. The IASB and the FASBafter review of the FASB statement 131 Disclosures about Segments of an Enterprise and RelatedInformation and IAS 14 Segment reporting collaborated and issued the new IFRS 8 Operating Segment.IFRS 8 requires that an entity report on the financial and descriptive information about itsreportable segments. IFRS 8 requires that a measure of the operating profit or loss, the segmentassets and liabilities be reported. A reconciliation of total segments` reportable revenues, totalprofit or loss, total assets, liabilities and other amounts disclosed for reportable segments tocorresponding amounts in the entity’s annual financial statements should be reported. IFRS 8 alsorequires entities to report on information about revenues derived from its products or services,about countries in which they earn revenues and hold assets and the major customers. In addition, adescription of how each segment was determined, the products and services provided per segment andany differences in determining the segment`s information.Although IFRS 8 is effective for annual periodscommencing on or after January 1, 2009, we have decided to early adopt the standard from the yearending June 30, 2008.
In December 2007, the IASB issued IFRS 2 (Amended) — Share Based Payment on vesting conditionsand cancellations. The amendment deals with two matters: (a) it clarifies that vesting conditionsare service conditions and performance conditions only; (b) It specifies all cancellations, whetherby the entity or by other parties, should receive the same accounting treatment. IFRS 2 becomeseffective for annual periods commencing on or after January 1, 2009, early adoption is permitted.The effect of the amended IFRS 2 will be recorded in future periods when such transactionsaffecting vesting conditions and cancellations on share based payment occurs.
In January 2008, the IASB issued IAS 23 (Revised) — Borrowing Costs. The statement eliminatesthe choice regarding capitalization of borrowing costs. Where an asset is acquired, constructed orproduced as a qualifying asset, it has to capitalize the borrowing costs relating to the assetagainst the cost price of the asset. All other borrowing costs are expensed. Excluded from theamended statement are inventories that are manufactured, or otherwise produced in large quantitieson a repetitive basis; and qualifying asset measured at fair value. The
107
statement comes into effect for annual periods commencing on or after January 1, 2009. We haveearly adopted the revised IAS 23 and the disclosures in this regard are included in our financialstatements.
In February 2008, the IASB issued amendments to IAS 32- Financial Instruments: Presentationand IAS 1 — Presentation of Financial Statements, the amendment aims to improve the accounting forparticular types of financial instruments that have characteristics similar to ordinary shares butare at present classified as financial liabilities. IAS 32 requires a financial instrument to beclassified as a liability if the holder of that instrument can require the issuer to redeem it forcash; currently these financial instruments are considered liabilities, rather than equity. Theamendments to IAS 32 addresses this issue and require entities to classify the following types offinancial instruments as equity, provided they have particular features and meet specificconditions: (a) puttable financial instruments; (b) instruments, or components of instruments, thatimpose on the entity an obligation to deliver to another party a pro rata share of the net assetsof the entity only on liquidation. The amendments become effective for annual periods commencing onor after January 1, 2009 early application is permitted. We do not expect the adoption of these amendments to have an impact on ourconsolidated financial statements.
In May 2008,IFRIC issued interpretation No.16, Hedges of a Net Investment in a ForeignOperation (IFRIC 16),which provides guidance on: (a) identifying the foreign currency risks thatqualify as a hedged risk in the hedge of a net investment in a foreign operation; (b) where,within a group, hedging instruments that are hedges of a net investment in foreign operation can beheld to qualify for hedge accounting; ( c) and how an entity should determine the amounts to bereclassified from equity to profit or loss for both the hedging instrument and the hedged item.IFRIC 16 applies to entities that hedges on foreign currency risk arising from net investments inforeign operations and where the related hedge qualify for hedge accounting in accordance with IAS39, Financial Instruments: Recognition and Measurement. The provisions of IFRIC 16 are effectivefor annual periods commencing on or after October 1, 2008, the effect of the change will beaccounted for prospectively in future periods. We currently do not anticipate the change affectingour financial statements as we do not have hedges on our net investments in foreign operations.
In May 2008 the IAS issued IFRS 1(Amended) — First-time Adoption of International FinancialReporting Standards and IAS 27 (Amended) — Consolidated and Separate Financial Statement — Cost ofan investment in Subsidiary, Jointly Controlled Entity or Associate. The amendments to IFRS 1 allowfirst-time adopters, in their separate financial statements, to use a deemed cost option fordetermining the cost (in terms of IAS 27, paragraph 38(a)) of an investment in subsidiary, jointlycontrolled entity or associate. The deemed cost of such an investment shall be: (a) Fair value(determined in accordance with IAS 39 — Financial Instruments: Recognition and Measurement) at theentity’s date of transition to IFRS’s; or (b) previous GAAP carrying amount at that date. Theamendments to IAS 27 remove the definition of the ‘cost method’ from paragraph 4 of the standard.In addition, when an entity reorganizes the structure of its group by establishing a new entity asits parent ( subject to certain criteria), the amendments require the new parent to measure cost asthe carrying amount of its share of the equity items shown in the separate financial statements ofthe original parent at the date of the reorganization. The standard becomes effective for annualperiods commencing on or after January 1, 2009, early adoption is permitted. The effect of theamended IFRS 1 and IAS 27 will be recorded in future periods when such transactions are enteredinto.
Liquidity and Capital Resources
We centrally manage our funding and treasury policies. There are no legal or economicrestrictions on the ability of our subsidiaries to transfer funds to us. We have generally fundedour operations and our short-term and long-term liquidity requirements from (i) cash generated fromoperations, (ii) credit facilities and other borrowings and (iii) sales of equity securities.
Cash Resources
| | | | | | | | | | | | | |
| | | Fiscal year ended June 30, |
| | | 2008 | | 2007 | | 2006 |
| | | ($ in millions) |
Continuing operations | | | | | | | | | | | | |
Operating cash flows | | | 165 | | | | 176 | | | | 38 | |
Investing cash flows | | | (313 | ) | | | (318 | ) | | | (291 | ) |
Financing cash flows | | | 78 | | | | 132 | | | | 8 | |
Foreign exchange differences | | | 5 | | | | 6 | | | | 42 | |
Total cash flows from continuing operations | | | (65 | ) | | | (4 | ) | | | (203 | ) |
108
| | | | | | | | | | | | | |
| | | Fiscal year ended June 30, |
| | | 2008 | | 2007 | | 2006 |
| | | ($ in millions) |
Discontinuedoperations | | | | | | | | | | | | |
Operating cash flows | | | 71 | | | | (17 | ) | | | 17 | |
Investing cash flows | | | (16 | ) | | | — | | | | 41 | |
Financing cash flows | | | — | | | | — | | | | (25 | ) |
Foreign exchange differences | | | (7 | ) | | | — | | | | (6 | ) |
Total cash flows from discontinued operations | | | 48 | | | | (17 | ) | | | 27 | |
Operations
Net cash provided by operations is primarily affected by the quantities of gold sold, the goldprice, the Rand-U.S. dollar exchange rate, cash costs per ounce and, in the case of theInternational operations, the Australian dollar and Kina versus U.S. dollar exchange rate. Asignificant adverse change in one or more of these parameters could materially reduce cash providedby operations as a source of liquidity.
Net cash generated by operations was U.S.$236 million in fiscal 2008, as compared withU.S.$159 million in fiscal 2007. This improvement is attributable primarily to the higher goldprice received during the year as well as the increase in interest received of U.S.$13 million.Negating the effect of the improvement was the increase in interest paid of U.S.$26 million andtaxation paid of U.S.$16 million. An increase in the production costs of U.S.$82 million due toinflationary pressures relating to labor, materials and energy supplies also negatively affectedthe increase.
Net cash generated by operations was U.S.$159 million in fiscal 2007, as compared with U.S.$55million in fiscal 2006. This improvement is attributable primarily to the higher gold pricereceived during the year. Contributing to the improvement was the decrease in the working capitalcharges of U.S.$39 million. Negating the effect of the improvement was the decrease in interestreceived of U.S.$8 million.
Investing
Net cash utilized by investing activities was U.S.$329 million in fiscal 2008, as comparedwith U.S.$318 million in fiscal 2007. This increase was mainly due to the increase in capitalexpenditure during fiscal 2008 by U.S.$169 million to U.S.$552 million. An increase of U.S.$129million in fiscal 2008 from proceeds on disposal of listed investments offset the increase in cashutilized during fiscal 2008. Also offsetting the amounts was an increase in proceeds on disposal ofmining assets, including the disposal of South Kalgoorlie (U.S.$9 million) and a increase in therestricted cash balance (U.S.$32 million).
Net cash utilized by investing activities was U.S.$318 million in fiscal 2007, as comparedwith U.S.$250 million in fiscal 2006. During fiscal 2006 capital expenditure increased by U.S.$108million to U.S.$383 million, which decreased the cash generated from investing activities.
Financing
Net cash generated by financing activities was U.S.$78 million in fiscal 2008, as comparedwith U.S.$132 million in fiscal 2007. This decrease was mainly due to the fact that we raised lessborrowings during the year.
Net cash generated by financing activities was U.S.$132 million in fiscal 2007, as comparedwith the net cash utilized was U.S.$17 million in fiscal 2006. This increase was mainly due to theraising of borrowings during the year as well as the decrease in repayment of borrowings.
Outstanding Credit Facilities and Other Borrowings
On July 30, 2003, Africa Vanguard Resources (Doornkop) (Proprietary) Limited (“AVR”) enteredinto a term loan facility of R140 million (U.S.$19 million) with Nedbank Limited (“Nedbank”) forthe purpose of partially funding AVR’s purchase of an undivided 26% share of the Mining titles, tobe contributed to the Doornkop South Reef Project with Randfontein. Interest at a fixed rate equalto Johannesburg Interbank Agreed Rate (“JIBAR”) plus 2%, compounded monthly, and any stamp dutiesand holding costs. The loan matures on July 30, 2008, at which date all loan amounts and anyinterest accrued are to be paid. The loan is jointly and severally guaranteed by the Company andseveral of its subsidiaries. The facility from Nedbank to AVRD is guaranteed by us and certain ofour subsidiaries. Interest capitalized during the fiscal 2008 was U.S.$4.1 million compared toU.S.$2.2 million in fiscal 2007 (fiscal 2006 was U.S.$2.3 million). During fiscal 2005, AfricaVanguard
109
borrowed an additional R18 million (U.S.$2.8 million) from its holding company AfricaVanguard Resources to service working capital commitments. The loan is uncollateralized and interest free.As there are no fixed repayment terms, the loan has no fixed maturity date.
On May 21, 2004, we issued R1.7 billion (U.S.$252.0 million) in international unsecuredfixed-rate convertible bonds in order to refinance our domestic Rand debt. We pay interest on theconvertible bonds of 4.875% per annum, payable semi-annually in arrears on May 21 and November 21of each year. The bonds are convertible at the option of the bondholders into fully paid upordinary shares at any time on or after July 1, 2004 and up to, and including, May 15, 2009, unlessthey have been previously redeemed, converted or purchased and cancelled by us. The trust deed forthe convertible bonds contains clauses that restrict certain of our activities, including anegative pledge, according to which we will not create or permit any mortgage, charge, lien, pledgeor other form of encumbrance of security interest with respect to any part of our undertaking orassets, present or future, to secure any relevant debt, guarantee or indemnity. In addition, thetrust deed contains covenants that require us to, among other things, maintain the listing of thebonds with the UK Listing Authority and to all things necessary, in the opinion of the trustee, togive effect to the trust deed. Including in the amortization charge as per the income statement isU.S.$1.2 million compared to U.S.$1.2 million in 2007 and U.S.$1.4 million in 2006 for amortizationof the bond issue costs.
During July 2007, Morobe Consolidated Goldfields entered into a finance lease agreement withWestpac Bank for the purchase of mining fleet to be used on the Hidden Valley project amounting toU.S.$37 million. Interest is charged at U.S. — LIBOR plus 1.25% per annum. Interest is accruedmonthly and lease instalments are repayable quarterly terminating June 30, 2013. The mining fleetfinanced is used as collateral for these loans. The balance at June 30, 2008 was U.S. $33 million.
On September 28, 2007, we entered into a term loan facility of R2 billion (U.S.$283.9 million)with Nedbank Limited, for the purpose of partially funding capital expenditure in respect ofprojects, as well as to repay the short term bridging loan amounting to R500 million (U.S.$68.6million). Interest accrues on a day to day basis over the term of the loan at a variable interestrate, which is fixed for three month periods, equal to the JIBAR plus 2.75% plus banking costs. Theloan is repayable on December 29, 2008 and interest is repayable every quarter commencing onSeptember 28, 2007.
Recently Retired Credit Facilities and Other Borrowings
On April 15, 2005 the ARM Empowerment Trust entered into a term loan facility of R474 million(U.S.$75.4 million) with Nedbank Limited for the purpose of funding the balance of the ARMEmpowerment Trust’s acquisition of the ARM shares held by us. The loan bore interest, compoundedmonthly, at a rate of JIBAR plus of 1.5%. We guaranteed this loan, subject to a maximum guaranteedamount of R367.4 million (U.S.$50.4 million) plus interest. In addition, if the ARM EmpowermentTrust chose to dispose of 8,175,640 of its ARM Limited shares at cost, the maximum guaranteedamount would be reduced to R214.9 million (U.S.$29.5 million) plus interest. We also entered intoan indemnity agreement with ARM Limited, pursuant to which ARM Limited indemnified us against 50%of all claims under the guarantee, subject to a maximum of R107.4 million (U.S.$14.7 million) plusinterest thereon at the applicable rate from May 26, 2006. Interest capitalized during the yearended 2008 amounted to U.S.$2.5 million, compared to U.S.$8.5 million for fiscal 2007. On September28, 2007, the guarantee was cancelled by Nedbank and, consequently, we have no further obligationto Nedbank in this regard.
On April 15, 2005, the ARM Empowerment Trust entered into a second term loan facility of R356million (U.S.$56.7 million) with Nedbank Limited for the purpose of funding the ARM EmpowermentTrust’s partial acquisition of the ARM shares held by us. The loan bore interest, compoundedmonthly, at a rate of JIBAR plus 1.5%. Interest capitalized during the year ended 2008 amounted toU.S.$2.1 million, compared to U.S.$6.7 million for fiscal 2007. On September 28, 2007, theguarantee was cancelled by Nedbank and consequently we have no further obligation to Nedbank inthis regard.
On March 20, 2007, we arranged financing from RMB, collateralized by 5,747,000 shares in GoldFields, resulting in total cash proceeds of R750.3 million (U.S.$103.4 million). Of these proceeds,R599.8 million (U.S.$82.3 million) were applied towards partial repayment of the R1.0 billion termloan facility with RMB. See below in this section. Interest was payable at a rate equal to theSAFEX Financial Derivatives overnight deposit rate (the “Safex Overnight Rate”) plus 35 basispoints. On August 24, 2007, we repaid the loan.
110
On March 20, 2007, Randfontein (our wholly-owned subsidiary) entered into a preference sharesubscription agreement with RMB. According to the terms of the agreement, following thesatisfaction of certain conditions, Randfontein issued R550.0 million (U.S.$75.4 million) principal amount of preference shares to RMBon April 5, 2007. Dividends on the preference shares were payable semi-annually on the principalamount and were calculated at 35% of the South African Prime Interest Rate from the issue dateuntil August 31, 2007, 50% of the South African Prime Interest Rate from September 1, 2007 toFebruary 29, 2008 and 83% of the South African Prime Interest Rate thereafter. The preferenceshares were guaranteed by us, Evander Gold Mines Limited, ARMgold/Harmony Freegold Joint VentureCompany (Pty) Limited, Avgold Limited and ARMgold/Harmony Joint Investment Company (Pty) Limited(“AHJIC”), as well as certain future material subsidiaries.
In the subscription agreement for the preference shares, AHJIC also granted a securityinterest over 6,196,863 Gold Fields shares held by it to secure its obligations under thesubscription agreement for the preference shares. In the subscription agreement for the preferenceshares, AHJIC also undertook that, if the cover ratio of the value of the Gold Fields shares to theredemption amount falls below 1.25, it would deposit additional Gold Fields shares or cash to bringthis ratio to 1.5. On or after March 1, 2008, if this ratio falls below 2.0, AHJIC will be requiredto deposit cash equal to 75% of the redemption amount.
The preference shares were redeemable at the option of the holders on the final redemptiondate, which is three years and one day after the issue date, and upon the occurrence of certainevents, including a failure by AHJIC to meet its obligations under the subscription agreement, adelisting of the Gold Fields shares from the Johannesburg Stock Exchange, cross-defaults or otherevents that are customary events of default for financing agreements. The preference shares werealso redeemable by Randfontein at any time. On August 24, 2007, the preference shares wereredeemed.
On June 29, 2007, we entered into a senior bridge loan facility for R500.0 million (U.S.$68.6million) with RMB for the purpose of funding our capital expenditure requirements in respect to theHidden Valley mine project. The loan bore interest, compounded monthly at a rate equal to the SafexOvernight Rate plus 2.4% until July 31, 2007, the maturity date. In the event that we elected toextend the loan facility until September 30, 2007, the loan would bear interest at a rate equal tothe Safex Overnight Rate plus 3.6% during the extension period. On September 29, 2007, the loan wassettled in full.
On June 27, 2007, we entered into a draw down facility agreement with Westpac Bank for the PNGoperations. The limit was K3 million and interest was payable at 9.45%. During July 2007, thefacility was repaid and then cancelled.
On March 9, 2006, we entered into a term loan facility of R1.0 billion(U.S.$159.7 million) with RMB, for the purpose of partially funding the acquisition of the 29.2%stake in Western Areas. Interest is compounded at a rate equal to three-month JIBAR plus 1.5%. Thisfacility was partially repaid on March 27, 2007 from the net proceeds of a sale of Gold Fieldsshares, and the balance was repaid on April 4, 2007 from the net proceeds from the issuance ofcertain preference shares by our subsidiary Randfontein.
Contractual Obligations and Commercial Commitments
Our contractual obligations and commercial commitments consist primarily of creditfacilities, post-retirement healthcare and environmental obligations
Contractual Obligations on the Balance Sheet
The following table summarizes our contractual obligations as of June 30, 2008:
| | | | | | | | | | | | | | | | | | | | | |
| | | Payments Due by Period |
| | | | | | | Less Than | | 12-36 | | 36-60 | | After 60 |
| | | | | | | 12 Months | | Months | | Months | | Months |
| | | | | | | July 1, 2008 | | July 1, 2009 | | July 1, 2011 | | Subsequent |
| | | | | | | to June 30, | | to June 30, | | To June 30, | | June 30, |
| | | Total | | 2009 | | 2011 | | 2013 | | 2013 |
| | | ($’million) | | ($’million) | | ($’million) | | ($’million) | | ($’million) |
Convertible uncollaterized bonds(1) | | | 229 | | | | 229 | | | | — | | | | — | | | | — | |
Africa Vanguard Resources(1) | | | 4 | | | | 4 | | | | — | | | | — | | | | — | |
Nedbank — AVR(1) | | | 25 | | | | 25 | | | | — | | | | — | | | | — | |
Westpac Bank(1) | | | 33 | | | | 4 | | | | 6 | | | | 23 | | | | — | |
Nedbank(1) | | | 256 | | | | 256 | | | | — | | | | — | | | | — | |
Post retirement health care(2) | | | 16 | | | | — | | | | — | | | | — | | | | 16 | |
Environmental obligations(3) | | | 145 | | | | — | | | | — | | | | — | | | | 145 | |
Total contractual obligations | | | 708 | | | | 518 | | | | 6 | | | | 23 | | | | 161 | |
| | |
| (1) | | See Item 5. “Operating and Financial Review and Prospects — Liquidity and Capital Resources — Credit Facilities and Other Borrowings —Outstanding Credit Facilities and Other Borrowings”. |
| |
| (2) | | This liability relates to post-retirement medical benefits of former employees who retired prior to December 31, 1996 and is based onactuarial valuations conducted during fiscal 2008. |
| |
| (3) | | We make provision for environmental rehabilitation costs and related liabilities based on management’s interpretations of currentenvironmental and regulatory requirements. See Item 5. “Operating and Financial Review and Prospects — Critical Accounting Policies”. |
111
Contractual Obligations off the Balance Sheet
Our obligation with regards to operating leases is less than U.S.$1 million for the nextyear and relates to the International office in Brisbane.
Capital Expenditure
The following table sets forth our authorized capital expenditure as of June 30, 2008:
| | | | | |
| | | $’million |
Authorized and contracted for | | | 149 | |
Authorized but not yet contracted for | | | 221 | |
Total | | | 370 | |
Commercial Commitments
The following table provides details regarding our commercial commitments as of June 30, 2008:
| | | | | | | | | | | | | | | | | | | | | |
| | | Amount of Commitments Expiring by Period |
| | | | | | | Less | | | | | | |
| | | | | | | Than 12 | | 12-36 | | 36-60 | | |
| | | | | | | Months | | Months | | Months | | After 60 |
| | | | | | | July 1, | | July 1, | | July 1, | | Months |
| | | | | | | 2008 to | | 2009 to | | 2011 to | | Subsequent |
| | | | | | | June 30, | | June 30, | | June 30, | | to June 30, |
| | | Total | | 2009 | | 2011 | | 2013 | | 2013 |
| | | ($’million) | | ($’million) | | ($’million) | | ($’million) | | ($’million) |
Guarantees(1) | | | 24 | | | | — | | | | — | | | | — | | | | 24 | |
Capital commitments(2) | | | 149 | | | | 149 | | | | — | | | | — | | | | — | |
Total commitments expiring by period | | | 173 | | | | 149 | | | | — | | | | — | | | | 24 | |
| | |
| (1) | | Amount of Commitments Expiring by Period. |
| |
| (2) | | Capital commitments consist only of amounts committed toexternal suppliers, although a total of U.S.$380 millionhas been approved by the Board for capital expenditures. |
Trend Information
Information on recent trends in our operations is discussed in Item 4. “Information onthe Company — Business — Strategy” and “— Results of Operations” above.
Working Capital and Anticipated Financing Needs
The Board believes that our working capital resources, by way of cash generated fromoperations and existing cash on hand, are sufficient to meet our present working capital needs.Several of the Growth projects will require a great deal of capital expenditure over the next twoto
112
threeyears, and given the current cash position, we are re-evaluating the planned capital expenditure, together with project timelines.Additional funding options are being investigated, including debt raising and the disposal ofcertain assets. Should a decision be taken to reduce or cease capital expenditure on one or moreof the projects, the effect would be to delay the start of production, and therefore the associatedrevenue stream. This could have an impact on available cash resources. For more information on ourplanned capital expenditures, see ” — Capital Expenditures” above and Item 4. “Information on theCompany — Business — Harmony’s Mining Operations”. We may, in the future, explore debt and/orequity financing in connection with our acquisition strategy and/or major capital projects. SeeItem 3. “Key Information — Risk Factors — Harmony’s strategy depends on its ability to makeadditional acquisitions”. Our Board believes that we will have access to adequate financing onreasonable terms given our cash-based operations and modest leverage. Our ability to generate cashfrom operations could, however, be materially adversely affected by increases in cash costs,decreases in production, decreases in the price of gold and appreciation of the Rand against theU.S. dollar. Access to financing could also be limited by provisions of our corporate bonds, underwhich we may not permit encumbrances on our present or future assets or revenues to secureindebtedness for borrowed money, without securing the outstanding bonds equally and ratably withsuch indebtedness, except for certain specified permitted encumbrances. See Item 5. “Operating andFinancial Review and Prospects — Liquidity and Capital Resources — Credit Facilities and OtherBorrowings — Outstanding Credit Facilities and Other Borrowings”. Future financing arrangementswould also be subject to the limits on the Board’s borrowing powers described in Item 10.“Description of Ordinary Shares — Memorandum and Articles of Association — Directors — BorrowingPowers”. In addition, South African companies are subject to significant exchange controllimitations, which may impair our ability to fund overseas operations or guarantee creditfacilities entered into by overseas subsidiaries. See Item “10. Additional Information — ExchangeControls and Other Limitations Affecting Security Holders”.
Other Financial Information
Export Sales
In fiscal years 2007 and 2008, 100% of our gold produced in South Africa was refined byRand Refinery, which is owned by a consortium of the major gold producers in South Africa. Infiscal 2006 approximately 84% of our gold produced in South Africa was refined by us with thebalance refined at the Rand Refinery. All of our gold produced in Australia in fiscal 2008, 2007and 2006 was sold to AGR Matthey, a Perth-based refinery.
113
Item 6. DIRECTORS, SENIOR MANAGEMENT AND EMPLOYEES
Directors and Senior Management
The members of the Board, their principal past affiliations, information on theirbusiness experiences and principal outside activities and selected other information are set forthbelow:
Board of directors
| | | | | |
| Name | | Date of appointment | | Date of resignation |
Patrice Motsepe (1) | | September 23, 2003 | | By rotation or resignation |
Bernard Swanepoel | | May 16, 1995 | | Resigned on August 6, 2007 |
Frank Abbott (2) | | October 1, 1994 | | By rotation or resignation |
Graham Briggs | | August 6, 2007 | | By rotation or resignation |
Joaquim Chissano (1) (3) | | April 20, 2005 | | By rotation or resignation |
Fikile De Buck(1) (3) | | March 30, 2006 | | By rotation or resignation |
Ken Dicks (1) (3) | | February 13, 2008 | | By rotation or resignation |
Cheick Diarra (1) (3) | | March 5, 2008 | | By rotation or resignation |
Dr Simo Lushaba (1) (3) | | October 18, 2002 | | By rotation or resignation |
Cathie Markus (1) (3) | | May 1, 2007 | | By rotation or resignation |
Modise Motloba (1) (3) | | July 30, 2004 | | By rotation or resignation |
Nomfundo Qangule | | July 26, 2004 | | Resigned on August 21, 2007 |
Cedric Savage (1) (3) | | September 23, 2003 | | By rotation or resignation |
André Wilkens (1) | | August 6, 2007 | | By rotation or resignation |
| | |
| (1) | | Non-executive directors |
| |
| (2) | | Frank Abbott served as a non-executive director until August 20, 2007 andwas appointed interim financial director on August 21, 2007. |
| |
| (3) | | Independent |
Non-Executive Chairman
Patrice Motsepe (46) BA (Legal), LLB. Patrice was appointed to the board in 2003. Patrice wasa partner in one of the largest law firms in South Africa, Bowman Gilfillan Inc. He was a visitingattorney in the USA with the law firm, McGuire Woods Battle and Boothe. In 1994 he founded FutureMining, which grew rapidly to become a successful contract mining company. He then formed ARMgoldin 1997, which listed on the JSE in 2002. ARMgold merged with Harmony in 2003 andthis ultimately led to the takeover of Anglovaal Mining (Avmin) by ARM. In 2002 he was voted SouthAfrica’s Business Leader of the Year by the CEOs of the top 100 companies in South Africa. In thesame year, he was winner of the Ernst & Young Best Entrepreneur of the Year Award. He is also theExecutive Chairman of ARM Limited and the Deputy Chairman of Sanlam. His various businessresponsibilities included being President of Business Unity South Africa (BUSA) from January 2004to May 2008, which is the voice of organised business in South Africa. He is also President ofMamelodi Sundowns Football Club.
Executive Directors
Graham Briggs (55), BSc (Hons) (Geology), PrSciNat — Chief Executive. Graham was appointed tothe board in August 2007. Graham has 36 years’ experience in the mining industry. He joined Harmonyas New Business Manager in 1995 and was promoted to Chief Executive Officer of Harmony Australiaand Regional Manager for Australasia from 2005 to 2007. He was appointed Acting Chief ExecutiveOfficer in August 2007 and in January 2008 appointed as Chief Executive Officer in January 2008. Hebegan his career in geology as a field assistant in 1972 and was exposed to various explorationprojects. Before attending university, Graham spent most of his time on gold exploration in theFree State, South Africa. While at Gengold he spent time on various mines in South Africa includingBuffelsfontein, West Rand Consolidated, Grootvlei and ending as an ore reserve manager at Beatrix.Graham serves as a director of Harmony’s subsidiaries.
114
Frank Abbott (53), BCom, CA (SA), MBL — Interim Financial Director. Frank was appointed anexecutive director in August 2007. Frank joined the Harmony board as a non-executive director in1994, after which he was appointed as financial director of the company in 1997. Following the ARMLimited/ARMI transaction, it was agreed by the board that Frank be appointed financial director ofARM while remaining on Harmony’s board as a non-executive director. In August 2007, Frank wasseconded to Harmony as interim financial director. Frank serves as a director of Harmony’ssubsidiaries and is a non-executive director of ARM Limited.
Non-Executive Directors
JoaquimChissano (68) — independent non-executive Director. Joaquimwas appointed to Harmony’s Board in April 2005. Joaquim is theformer president of Mozambique. He has served Mozambique in manycapacities, initially as founding member of the Frelimo movementduring that country’s struggle for independence. Subsequent toindependence in 1975, he was appointed foreign minister, and on thedeath of Samora Machel, assumed the office of the President. Frelimocontested and won the multi-party elections in 1994 and 1999,returning Joaquim to presidency on both occasions. He declined tostand for a further term of office in 2004. His presidency commencedduring a devastating civil war and ended with a sustainable peace andimportant economic growth. He served a term as chairman of theAfrican Union from 2003 to 2004. Mr. Chissano is also a non-executivedirector of ARM Limited and TEAL.
Fikile De Buck (48), BA (Economics), FCCA (UK) — Independent non-executive director. Fikilejoined the board on 1 April 2006. A certified chartered accountant, she is a fellow of theAssociation of Chartered Certified Accountants (ACCA) (UK) and a member of the Association ofChartered Certified Accountants (ACCA) (UK). In 1990, Fikile won the Stuart Crystal Prize, awardedto the best accounting student at the Birmingham Polytechnic in the United Kingdom. She was thechief operations officer and chief financial officer of the Council for Medical Schemes in SouthAfrica where she held various positions from September 2000 until February 2008, when she resignedfrom her executive position. Prior to that, she was treasurer at the Botswana DevelopmentCorporation. Fikile is also a non-executive director of Rand Uranium (Proprietary) Ltd. and AnooraqResources Corporation.
Dr Cheick Diarra (56), PHD (Mechanical and Aerospace Engineering) Independent non-executivedirector. Dr Cheick Diarra joined the Board as non-executive director on 5 March 2008. He is thechairman for Africa at Microsoft, responsible for Microsoft’s broad scale citizenship, educationand developmental activities on the continent. Dr Diarra graduated from Pierre & Marie CurieUniversity in Paris, France and went on to attain his PhD in mechanical and aerospace engineeringfrom Howard University, Washington DC, USA. After six years as an Assistant Professor at Howard, hejoined the National Aeronautic and Space Association (NASA) Jet Propulsion Laboratory. As aninterplanetary navigator, he oversaw five NASA missions, including the Magellan mission to Venus,the Ulysses mission to the poles of the Sun, the Galileo mission to Jupiter and the Mars Observermission. He then served as the navigator and public outreach manager for the Mars Pathfindermission. In 1999, in his personal capacity, Dr Diarra created the Pathfinder Foundation forEducation and Development — an organisation that encourages and supports female students in theirpursuit of scientific education. In 2002, he was appointed CEO of the African Virtual University(AVU), an internationally respected organisation. Late in 2003, Dr Diarra returned home to Maliand, began working on his farm to find solutions to the continent’s challenges with food securityand nutrition. He is a member of a number of international and African scientific organisations,and has been awarded the African Lifetime Achievement award for outstanding Contributions toScience.
Ken Dicks (69), Mine Managers Certificates (Metalliferous and Fiery Coal Mines); ManagementDevelopment Diploma and Management Diploma — Independent non-executive director. Ken was appointedto the Board with effect from 13 February 2008. He retired from Anglo American in 1997 after 37years service. Ken has 39 years’ experience in the mining industry, 37 of which were spent in goldmining. He has served in various senior management positions as well as on mining companies’ boardsnamely Freegold Limited, Western Deep Levels and Elandsrand. He is also a non-executive director ofAflease Gold Limited.
115
Dr Simo Lushaba (42), Bsc (Hon), MBA and DBA — Independent non-executive director. Simo is anentrepreneur and an executive business coach. He focuses on business and leadership development,and has interests in businesses in telecommunications, financial services, energy, transport andlogistics. He has worked as General Manager — Operations (Spoornet), Vice President — SharedBusiness Services (Lonmin plc) and as Chief Executive (Rand Water). He is also a member of theBoard of the Nepad Business Foundation (SA). He is also a non-executive director of Rand Uranium(Proprietary) Ltd.
Cathie Markus (51), BA LLB — Independent non-executive director. Cathie joined the board witheffect from 1 May 2007, bringing with her significant experience and a wealth of knowledge relatingto the mining industry. After graduating from the University of the Witwatersrand, Cathie servedarticles at Bell Dewar and Hall and qualified as an attorney, notary and conveyancer before joiningthe legal department of Dorbyl Limited. She joined Impala Platinum Holdings Limited (Implats) in1991 as Legal Adviser and was appointed an Executive Director in 1998, and oversaw, among others,the legal, administrative, public affairs and investor relations functions for the group. Sheretired from Implats in 2007.
Modise Motloba (42), BSc, Diploma in Strategic Management — Independent non-executivedirector. Modise Motloba (42), Bachelor of Science, and Diploma in Strategic Management —Independent non-executive director. Modise was appointed to the boardin July 2004. Modise who iscurrently the Chief Executive Officer of Quartile Capital (Pty) Ltd,has more than 17 years’ local andglobal experience in investment banking, treasury, fund management, management consulting andinformation technology. He worked for both local and internationalcorporates such as PricewaterhouseCoopers, Rand Merchant Bank, African Merchant Bank, AfricaHarvest Fund Managers and Goldman Sachs. Modise is a former President of Association ofBlack Securities and Investment Professionals (ABSIP) which he ledtogether with the Black Business Council,in formulating and negotiating the historic Financial Services Charter in October 2003. He is therecipient of the prestigious 2003 Black Business Quarterly Investment Specialist and ABSIP’sPioneer in the Financial Sector awards. Modise is a member of the South Africa Reserve Bank’s Standing Committee on theRevision of the Bank’s Act 1990. He gained experience in chamber business organisations whileserving as the President of the Johannesburg Chamber of Commerce (JCCI) in 2005 and as a member ofthe Trade Committee of Business Unity South Africa (BUSA). His otherkey directorships include those atRand Merchant Bank Structured Insurance, Deutsche Bank Securities SA (Pty) Ltd., Landbank and SmallEnterprise Foundation.
Cedric Savage (69), BSc (Eng), MBA, ISMP (Harvard) — Independent non-executive director.Cedric joined the Board in September 2003. He started his career in the United Kingdom in 1960 as agraduate engineer with Fairey Aviation. He returned to South Africa in 1963 and worked in the oil(Mobil), textile (Felt & Textiles) and chicken (Rainbow Chickens Limited) industries. He waspresident of the South African Chamber of Business from 1993 to 1994. He has also served aschairman of the Board of Governors of the University of KwaZulu-Natal’s Development Foundation andas a member of Council of that university. He joined the Tongaat-Hulett Group Ltd in 1977 asmanaging director of Tongaat Foods and progressed to executive chairman of the Building MaterialsDivision; he became chief executive officer of the group in 1991. In May 2000, he assumed the dualroles of chief executive officer and executive chairman. He is currently non-executive chairman ofthe group and serves on a number of other boards including those of the Datatec Limited and Denel(Pty) Ltd. He also served on the Nedbank board from 2002 until 14 May 2008 when he retired asnon-executive director.
André Wilkens (58), Mine Manager’s Certificate of Competency, MDPA, RMIIA, Non-executivedirector. André was appointed to the Board in August 2007. He is currently the chief executiveofficer of ARM having formerly been the chief executive of ARM Platinum, a division of ARM. Priorto this, he was the chief operating officer of Harmony, following the merger of the company withARMgold in 2003. He had served as chief executive officer of ARMgold after joining that company in1998. The balance of his 34 years’ experience in the mining industry was gained with Anglo AmericanCorporation of South Africa, where he began his career in 1969 and which culminated in hisappointment as mine manager of Vaal Reefs South Mine in 1993.
Management
The members of our management, their principal past affiliations, information on theirbusiness experiences and principal outside activities and selected other information are set forthbelow:
Bob Atkinson (56), NHD (Metalliferous Mining). Bob joined Harmony as a productionmanager in 1986 and served as Operations Director on the Executive Committee from June 2001 to May2003. In 2004, he was appointed Chief Operating Officer at Harmony Gold Australia and was appointedas Executive, Sustainable Development (Safety and Occupational Health) at Harmony in South Africain July 2004. He currently serves asOperations Director of Projects and New Business. He has more than 30 years’ experience in themining industry.
116
Jaco Boshoff (39), BSc (Hons), MSc (Geology), MBA, PrSciNat. Jaco joined Harmony in April1996. Since March 2004, he has served as the Reserves and Resources Executive and Competent Person.Prior to this, he was an Ore Reserve Manager from 1998 to 2004 and before that was a geologist atHarmony and at Gengold. Jaco is registered as a professional geological scientist with the SouthAfrican Council for Natural Scientific Professions and has worked in the mining industry for morethan 11 years.
Johannes van Heerden (35), BCompt (Hons), CA(SA). Johannes joined Harmony in 1998 as FinancialManager of the Free State operations. Here he obtained broad financial management experience at anoperational level. He was subsequently appointed Group Financial Manager in 2001, before beingrelocated to Harmony Australasia as Chief Financial Officer in 2003. Johannes presently holds theposition of Managing Director International Operations Chief Executive (South East Asia).
Mashego Mashego (44), BA Ed, BA (Hons), GEDP, JMDP. Mashego joined Harmony in July 2005 asGroup Human Resources Development Manager. Mashego, who has more than 19 years’ experience in thefield of Human Resources, started his career at Eskom where he was Human Resources Manager for nineyears. He then moved to JCI as Corporate Human Resources Manager. Thereafter, he was Senior GeneralManager for three years at Atlantis Diesel Engines and Vice President of Human Resources at FoskorLtd for six years. He was promoted to General Manager at Harmony’s Evander Operations in November2005. Mashego was appointed Executive, Human Resources in August 2007.
Jackie Mathebula (37), B Admin Honours, MBA, Master of Management (MM, HR). Jackie joinedHarmony in September 2002 as an employee relations and industrial relations executive. In 2004, hisportfolio was changed to that of Training, Human Resource Development and Occupational Health, andin 2005 to the position of Executive, Corporate Affairs. Prior to joining Harmony, he was a GeneralManager in Human Resources for Gensec Bank, a Human Resources Manager at Gold Fields Ltd and healso occupied various positions within the then Iscor group (now Mittal Steel South Africa). Hislast position at Iscor was that of Works Manager, human resources for the specialised steelproducts business. He also worked for the South African government in the Gazankulu Public ServiceCommission.
Alwyn Pretorius (36), BSc Mining Engineering & BSc Industrial Engineering (UP). Alwyn, amine manager at ARMgold, joined the company when Harmony merged with ARMgold in 2003. He began hiscareer at Vaal Reefs Gold Mine as a mining graduate in training in 1993 and was appointed shiftboss in 1995, gaining experience in remnant mining. Alwyn obtained a Mine Manager’s Certificate ofCompetence in 1997 and his BSc in Industrial Engineering in 1998. Alwyn joined ARMgold in 1999 atits Orkney operations. He became a mine overseer at ARMgold and was later appointed section managerat the same operation. He was appointed mine manager in 2003. Alwyn was appointed Executive, SouthAfrican Operations for Harmony in March 2007, and is the Chief Operating Officer for South Africanoperations, North Region.
Marian van der Walt (35), BCom (Law), LLB, Higher Diploma in Tax, Diploma in CorporateGovernance, Diploma in Insolvency Law, Certificate in Business Leadership. Marian has 11 years oflegal experience and was appointed Company Secretary on 3 February 2003. She completed her articlesat Routledges Modise Attorneys and was admitted as an attorney and conveyancer in 1998. She thenjoined Deloitte and Touche as an insolvencypractitioner/administrator. She held legal positions at theStandard Bank of South Africa Limited in the Commercial PropertiesDivision prior to joining Harmony in 2003. Marian was appointed tothe Executive Committee in October 2005 with responsibility for legal, compliance and riskmanagement. Internal audit and Sarbanes-Oxley compliance were added to her portfolio in September2007. In October 2008, she was appointed executive: corporate and investor relations.
Tom Smith (52), NHD (Mine Surveying and Metalliferous Mining). Tom joined Harmony in 2002.Tom began his career in the mining industry in 1975 as a sampler at Anglo American’s Vaal Reefsmine. He progressed through the survey department to become chief surveyor in 1988. He made acareer change in 1991 to mining and worked as a section manager on Great Noligwa, Elandsrand andMponeng mines. He was also involved in projects at Tau Lekoa and Moab Khotsong. Tom was promoted toProduction Manager at Mponeng in 1998. He was appointed General Manager of Tshepong in 2000.Following the merger with ARMgold he was involved in the Free State restructuring. He acquired workexperience in conventional, trackless, pillar- and deep-level mining. He joined the executive teamin September 2007 and is the Chief Operating Officer, South Region.
Abre van Vuuren (48), BComm, MDP, DPLR. Abre joined Harmony in 1997 from Grootvlei Mine, wherehe was Human Resources Manager. He was appointed to the Executive Committee in November 2000 and isresponsible for Services. He has approximately 25 years’ experience in the mining industry.
117
Board and Management Changes
The members of the Board and Harmony’s management that resigned from Harmony during and -postfiscal year-end , their principal past affiliations, information on their business experiences andprincipal outside activities and selected other information are set forth below:
FormerExecutive Directors
Bernard Swanepoel (46), BSc (Mining Engineering), BCom (Hons). Bernard resigned as ChiefExecutive of Harmony on August 6, 2007. He had started his career with Gengold in 1983, culminatingin his appointment as general manager of Beatrix Mine in 1993. He joined Randgold in 1995 asmanaging director of Harmony. For the past 11 years, Bernard has led the team behind the company’sgrowth and acquisition initiatives.
Nomfundo Qangule (40), BCom, BCom (Hons) CTA, CA (SA), Member of CAIB (SA) and the FinancialDirector of Harmony. Nomfundo resigned from the Board as an executive director on August 21, 2007.Prior to joining Harmony, Nomfundo was the Executive Manager of Worldwide African InvestmentHoldings (Pty) Ltd (WAIH). Other positions held by Nomfundo while at WAIH include chairperson ofthe Board of Argil Holdings (Pty) Ltd and non-executive director of CS Holdings Limited where sheserved as a member of the Remuneration, Audit and Investment committees. In addition, she was anExecutive Committee member and non-executive Director of Negotiated Benefits Consultants (Pty) Ltd.She started her career in the Corporate and International Division of Nedcor Bank Limited as aCredit Manager. Later she joined ABSA Corporate and Merchant Bank’s credit division. She is aqualified Chartered Accountant, a member of the Institute of Bankers and holds a certificate infinancial markets from Acumen.
FormerManagement
Boetie Swanepoel (47), BCompt (Hons), CA(SA). Boetie resigned from Harmony’s management on 31July 2007. Boetie joined Harmony from Beatrix Mine in 1995 as Financial Manager. He has more than21 years’ financial services experience, mostly in the mining industry. He was appointed to theExecutive Committee in November 2000 and was responsible for the development of Harmony’s shaftfinancial managers, the financial control environment and the service delivery departments.
Board Practices
Our Articles of Association provide that the Board must consist of no less than four andno more than twenty directors at any time. The Board currently consists of twelve directors.
Our Articles of Association provide that the longest serving one-third of directorsretire from office at each annual general meeting. Retiring directors normally make themselvesavailable for re-election and are re-elected at the annual general meeting on which they retire.Members of our senior management who are also directors retire as directors in terms of theArticles of Association, but their service as officers is regulated by standard industry employmentagreements. According to the Articles of Association, the Board meets not less than quarterly.
Details of directors’ service contracts are described under “— Compensation of Directorsand Senior Management” and “— Directors’ Terms of Employment,” below. We also describe significantways in which our corporate governance practices differ from practices followed by U.S. companieslisted on the NYSE on our website under “Corporate Governance.”
In order to ensure good corporate governance, the Board has formed anAudit Committee, a Remuneration Committee, a Nomination Committee, an Investment Committee, anEmployment Equity Committee, Sustainable Development Committee and a Technical Committee. All ofthe Board committees are comprised of a majority of non-executive directors.
ExecutiveManagement Committee
Our Executive Committee comprises our executive directors and selected senior officers,each with his or her own area of responsibility. The Executive Committee consists of 11 executiveswho meet on a weekly basis and more often if required.
Thecomposition of the Executive Management Committee (with areas of responsibility indicated) is asfollows:
| | | |
Graham Briggs | | Chief Executive |
| | |
Frank Abbott | | Interim Chief Financial Officer |
118
| | | |
Bob Atkinson | | Projects |
| | |
Jaco Boshoff | | Ore Reserves |
| | |
Mashego Mashego | | Human Resources |
| | |
Jackie Mathebula | | Corporate Affairs |
| | |
Alwyn Petorius | | Chief Operating Officer (North) |
| | |
Tom Smith | | Chief Operating Officer (South) |
| | |
Marian van der Walt | | Company Secretary; Legal and Compliance (as fromOctober 1, 2008, Corporate and Investor Relations) |
| | |
Johannes van Heerden | | Chief Executive Officer South East Asia |
| | |
Abre van Vuuren | | Corporate Services |
Audit Committee
Members:
In terms of its charter this committee must comprise at least three members.
As at June 30, 2008, the members of this committee were:
| | | |
Cedric Savage | | Chairman; appointed to the committee on January 26, 2004and chairman as from August 5, 2005 |
| | |
Fikile de Buck | | Appointed to the committee on March 30, 2006 |
| | |
Dr. Simo Lushaba | | Appointed to the committee on January 24, 2003 |
| | |
Modise Motloba | | Appointed to the committee on July 30, 2004 |
The internal and external auditors, the chief executive officer and executive managers areall invited to the Audit Committee meeting.
Frequency of meetings:
The Audit committee is, in terms of its charter, required to meet at least four times a year,or more frequently as circumstances dictate. During the financial year, the committee met on eightoccasions.
Purpose and function:
The Audit Committee was established to assist the board in discharging its duties relating tothe safeguarding of assets; the operation of adequate system and internal controls and controlprocesses; the preparation of accurate financial reporting and statements in compliance with allapplicable legal requirements, corporate governance and accounting standards. It also providessupport to the board on the risk profile and risk management of the group.
The Audit Committee reports and makes recommendations to the board, and the board retainsresponsibility for implementing such recommendations.
Independence/compliance:
All members of the Audit Committee are independent, non-executive directors.
Currently, we do not have an individual audit committee financial expert as defined by therules of the SEC. It is our contention that the audit committee members, through theircollective experience, do meet the majority of the definitions of the SEC for an audit committeefinancial expert in both the public and private sectors. The members have served as directors andofficers of numerous public companies and have over theyears developed a strong knowledge and understanding of IFRS,overseeing the preparation, audit and evaluation of financial statements. We believe that thecombined knowledge, skills and experience of the Audit committee, and their
119
authority to engageoutside experts to provide them with advice on matters relating to their responsibilities as theydeem appropriate, enables them as a group to act effectively in the fulfillment of tasks andresponsibilities required under U.S. Sarbanes Oxley Act of 2002.
Empowerment Committee
Members:
The Empowerment Committee must comprise of at least three members.
As at June 30, 2008, the members of this committee were as follows:
| | | |
Joaquim Chissano | | Chairman; Appointed as chairman with effect from May 3, 2006 |
| | |
Modise Motloba | | Appointed to the committee on May 3, 2006 |
| | |
Cathie Markus | | Appointed to the committee on October 29, 2007 |
Bernard Swanepoel resigned from this committee on 6 August 2007.
Thechief executive officer and executive managers are all invited toattend the EmpowermentCommittee meetings.
Frequency of meetings:
TheEmpowerment Committee met on two occasions.
Purpose and function:
The Empowerment Committee was established by the board to ensure that the company meets notonly regulations stipulated in the Employment Equity Act, the Labour Relations Act and the Mineraland Petroleum Resources Development Act’s Mining Charter Scorecard, but also in fulfilment of ourown empowerment imperatives.
The responsibilities of the Empowerment Committee include ensuring that a sustainableorganisational culture, structures and processes are in place to support the development ofempowerment in the company in line with the company’s needs and requirements; to monitor thedevelopment and progress of empowerment within the company; to address inequalities that may existin staff profiles and organisational practices; and to review and monitor whether appropriatesupport is given to previously disadvantaged staff in order to equip them for successful careers inthe company.
Independence/compliance:
The committee is chaired by an independent non-executive director and comprises ofindependent non-executive directors.
Investment Committee
Members:
The Investment Committee must comprise of at least three members.
As at June 30, 2008, the members were:
| | | |
Dr. Simo Lushaba | | Chairman; Appointed to the committee on January 26, 2004and as Chairman with effect from August 5, 2005) |
| | |
Frank Abbott | | Appointed to the committee on July 30, 2004 and resignedfrom the committee following his appointment as InterimFinancial Director on August 21, 2007 |
| | |
Fikile De Buck | | Appointed to the committee on May 3, 2006 |
| | |
Cedric Savage | | Appointed to the committee on January 26, 2004 |
| | |
André Wilkens | | Appointed to the committee on August 7, 2007 |
| | |
Cathie Markus | | Appointed to the committee on October 29, 2007 |
| | |
Ken Dicks | | Appointed to the committee on February 13, 2008 |
The chief executive officer and executive managers are invited to attend the meetings.
120
Frequency of meetings:
The committee should meet at least four times a year, but may, at its discretion, meet moreoften depending on the circumstances. The committee met on eight occasions in fiscal 2008.
Purpose and function:
The Investment Committee’s purpose was reviewed, following the implementation of the TechnicalCommittee in February 2008. The primary purpose of the Investment Committee is to considerprojects, acquisitions and the disposal of assets in line with the Group’s overall strategy. Thisincludes performing such other investment related functions as may be designated by the Board fromtime to time, considering the viability of the capital project and/or acquisition and/or disposaland the effect it may have on the Group’s cash flow, as well as whether it will fit the Group’soverall strategy and ensuring that due diligence procedures are followed when acquiring ordisposing of assets.
Independence/compliance:
The Investment Committee consists of six non-executive members. Of the six non-executive members, fiveare independent. The chairman is an independent, non-executivedirector. Members of the Executive Committee and the chief executiveofficer are invited to attend the meetings.
Nomination Committee
Members:
The Nomination Committee must comprise of at least three members.
As at June 30, 2008, the members of this committee were:
| | | |
Patrice Motsepe | | Chairman; Appointed to the committee on October 24, 2003 as Chairman |
| | |
Joaquim Chissano | | Appointed to the committee on May 3, 2006 |
| | |
Frank Abbott | | Appointed to the committee August 5, 2005 |
Frequency of meetings
Members of this committee are required to meet annually or more often at the committee’sdiscretion, depending on prevailing circumstances. In view of the fact that only one member of thecommittee is an independent non-executive director, any decisions by the Nomination Committee areapproved by the Board, either through a round robin resolution or at a Board meeting.
Purpose and function
The primary purpose of the Nomination Committee is to ensure that the procedures forappointments to the board are formal and transparent, by making recommendations to the board on allnew board appointments and reviewing succession planning for directors. The duties andresponsibilities of this committee are set out in the Nomination Committee charter, with which thecommittee is fully compliant.
Independence/compliance:
The chairman of the Nomination Committee is non-executive, but is not independent. To ensureappropriate levels of governance, the potential directors identified by the nominations committeeare considered by the board as a whole, the majority of whom are non-executive, independentdirectors.
Remuneration Committee
Members
The Remuneration Committee must comprise of at least three members.
As at June 30, 2008, the members of this committee were:
| | | |
Cedric Savage | | Chairman; Appointed to the committee on January 24, 2004,and as chairman from May 3, 2006 |
121
| | | |
Dr. Simo Lushaba | | Appointed to the committee on August 5, 2005 |
| | |
Patrice Motsepe | | Appointed to the committee on January 26, 2004 |
| | |
André Wilkens | | Appointed to the committee on August 7, 2007 |
The chief executive, HR Executive and Company Secretary are invited to attend all meetings.
Frequency of meetings:
The Remuneration committee is expected to meet at least on a quarterly basis or to pass aresolution in lieu of a formal meeting not held. In fiscal 2008, the committee met on one occasionand a number of round-robin resolutions were passed.
Purpose and function:
The primary purposes of the Remuneration Committee are to ensure that the group’s directorsand senior executives are fairly rewarded for their individual contributions to our overallperformance and to demonstrate to all stakeholders that the remuneration of our senior executivemembers is set by a committee of board members who have no personal interest in the outcome oftheir decisions, and who will give due regard to the interests of our shareholders and to ourfinancial and commercial health.
The committee’s primary objectives are to monitor and strengthen the objectivity andcredibility of our directors’ and senior executives’ remuneration system, and to makerecommendations to the board on remuneration packages and policies applicable to directors. Aformal reward philosophy was adopted by the Remuneration Committee in March 2006. This philosophyis reviewed annually by the committee.
Independence/compliance:
The committee comprises four non-executive directors, of which two are independent. It istherefore not compliant with King II which requires that the committee comprise independentdirectors only. The chairman of the Remuneration Committee is, however, an independentnon-executive director and ensures that decisions are non-bias and fair. The chairman attended theAGM which was held on November 26, 2007 to respond to any queries from shareholders.
Sustainable Development Committee
Members:
The Sustainable Development Committee must comprise of at least three members.
As at June 30, 2008, the following were members of this committee:
| | | |
Modise Motloba | | Chairman; Appointed as chairman on August 5, 2005 |
| | |
Joaquim Chissano | | Appointed to the committee on May 3, 2006 |
| | |
Fikile de Buck | | Appointed to the committee on May 3, 2006 |
Thechief executive officer and executive managers are invited to attend themeetings.
Frequency of meetings:
The Sustainable Development Committee should meet at least four times a year, or morefrequently as circumstances dictate. In fiscal 2008, four meetings of this committee were held.
Purpose and function:
The objective of the Sustainable Development Committee is to assist the board in ensuring thatwe are and remain a committed socially responsible corporate citizen. The committee’s primary roleis to supplement, support, advise and provide guidance on the effectiveness or otherwise ofmanagement’s efforts in respect of sustainable development.
The committee considers the following sustainable development issues: occupational health,safety, HIV/Aids, social investment and environmental management.
Independence/compliance:
The committee comprises entirely of independent, non-executive directors.
122
Technical Committee
Members:
The Technical Committee must comprise of at least three members.
As at June 30, 2008, the following were members of this committee:
| | | |
Andre Wilkens | | Chairman; Appointed as chairman on February 13, 2008 |
| | |
Ken Dicks | | Appointed to the committee on February 13, 2008 |
| | |
Modise Motloba | | Appointed to the committee on February 13, 2008 |
| | |
Cedric Savage | | Appointed to the committee on February 13, 2008 |
The chief executive and executive managers are all invited to attend the meetings.
Frequency of meetings:
The Committee should meet at least six times a year. The Committee, at its discretion, maydecide to change this requirement, depending on the circumstances. Bearing in mind that theTechnical Committee was only established in February 2008, three meetings of this committee wereheld between then and end of fiscal 2008.
Purpose and function:
The Technical Committee was formed in February 2008 to provide a platform for the chiefexecutive officer to discuss the company’s strategy, itsperformance against targets, its operational results andprojects. The Technical Committee keeps the Board informed of the developments, progress andchallenges facing the company’s operations. The strategic plansare considered by the Technical Committee and recommended forapproval to the Investment Committee and the Board. In addition, the Technical Committee provides guidanceand support to Management to ensure that the Company remains sustainable and successful.
The committee considers and reviews the company’s strategy, its performance targets and itsprojects on an annual basis; reviews the performance of the company and the chief executive;reports to the Board on the developments, progress and challenges facing the company’s operationson a quarterly basis and provides guidance and support to Management to ensure that the companyremains sustainable and successful.
Independence/compliance:
The committee comprises of three independent, non-executive directors. The chairman is notindependent, but it was agreed that he was best suited to be appointed as chairman, due to his vastknowledge of the company’s assets and his years’ of mining experience.
Compensation of Directors and Senior Management
The following table shows the compensation of directors and senior management for fiscal 2008:
| | | | | | | | | | | | | | | | | | | | | |
| | | | | | | | | | | Retirement | | | | |
| | | | | | | | | | | Contributions | | | | |
| | | Directors’ | | Salaries and | | during | | Bonuses | | |
| | | fee (1) | | Benefits | | the year | | Paid | | Total |
| | | ($’000) | | ($’000) | | ($’000) | | ($’000) | | ($’000) |
| Name | | 2008 | | 2008 | | 2008 | | 2008 | | 2008 |
Non-executive | | | | | | | | | | | | | | | | | | | | |
Patrice Motsepe | | | 87 | | | | — | | | | — | | | | — | | | | 87 | |
Mr Joaquim Chissano | | | 36 | | | | — | | | | — | | | | — | | | | 36 | |
Ms Fikile de Buck | | | 33 | | | | — | | | | — | | | | — | | | | 33 | |
Mr. Ken Dicks | | | 11 | | | | | | | | | | | | | | | | 11 | |
Mr. Cheick Diarra (1) | | | — | | | | — | | | | — | | | | — | | | | — | |
Dr Simo Lushaba | | | 36 | | | | — | | | | — | | | | — | | | | 36 | |
Cathie Markus | | | 26 | | | | — | | | | — | | | | — | | | | 26 | |
Modise Motloba | | | 44 | | | | — | | | | — | | | | — | | | | 44 | |
Cedric Savage | | | 46 | | | | — | | | | — | | | | — | | | | 46 | |
Andre Wilkens | | | 31 | | | | — | | | | — | | | | — | | | | 31 | |
123
| | | | | | | | | | | | | | | | | | | | | |
| | | | | | | | | | | Retirement | | | | |
| | | | | | | | | | | Contributions | | | | |
| | | Directors’ | | Salaries and | | during | | Bonuses | | |
| | | fee (1) | | Benefits | | the year | | Paid | | Total |
| | | ($’000) | | ($’000) | | ($’000) | | ($’000) | | ($’000) |
| Name | | 2008 | | 2008 | | 2008 | | 2008 | | 2008 |
Executive | | | | | | | | | | | | | | | | | | | | |
Nomfundo Qangule (2) | | | — | | | | — | | | | 254 | | | | — | | | | 254 | |
Bernard Swanepoel (3) | | | — | | | | — | | | | 265 | | | | 83 | | | | 348 | |
Frank Abbott (4) | | | — | | | | 199 | | | | 30 | | | | — | | | | 229 | |
Graham Briggs (5) | | | — | | | | 355 | | | | — | | | | 219 | | | | 574 | |
| | | | | | | | | | | | | | | | | | | | |
TOTAL | | | | | | | | | | | | | | | | | | | 1,755 | |
| | |
| (1) | | Dr Cheick Diarra has waived his directors’ fees. |
| |
| (2) | | Nomfundo Qangule resigned as Financial Director on August 21, 2007 |
| |
| (3) | | Bernard Swanepoel resigned as Chief Executive Officer on August 1, 2007 |
| |
| (4) | | Repayment of a portion of Frank Abbott’s salary to ARM Limited |
| |
| (5) | | Graham Briggs was appointed Acting Chief Executive Officer on 6 August2007 and Chief Executive Officer on January 1, 2008 |
Directors Terms of Employment
None of our directors have a service contract with us or any of our subsidiaries with anotice or contract period of one year or more or with provisions for pre-determining compensationon termination of an amount which equals or exceeds one year’s salary and benefits in kind.
The terms of employment of our executive directors continue until terminated by reachingthe mandatory retirement age of 60 or on service of 30 days’ notice by either us or the employee.Each of our executive directors participates in our share option scheme and a discretionaryexecutive profit share scheme, the latter provided that certain profit targets, set by theRemuneration Committee, are achieved. They have all waived their rights to directors’ fees.
The executive directors also benefit from pension contributions, provident funds, lifeinsurance and medical aid, the value of which is included in the salary details listed above. Thetotal amount currently set aside or accrued by us and our subsidiaries for the payment of thesepension, life insurance, medical aid and retirement benefits is approximately U.S.$786 million).The non-executive directors are entitled to fees as agreed at our annual general meeting from timeto time, reimbursement of out-of-pocket expenses incurred on our behalf and remuneration for otherservices, such as serving on committees. For fiscal 2008, total directors’ remuneration amounted toU.S.$1.8 million and senior management’s remuneration to U.S.$2.7 million.
Non-executive directors are paid as per the chart below. Executives participate in anexecutive bonus scheme and bonuses (if any) are determined for a financial year by the RemunerationCommittee In line with our reward philosophy. This is paid in equal parts over a three year term,provided that the executive is in service of the company on date of payment. A bonus ofU.S.$302,000 was awarded to the chief executive officers during the past financial year.
The board has agreed to an increase in non-executive directors’ fees, effective from July 1,2008. The increase granted is to ensure that non-executive directors’ fees remain competitive.Shareholders will be required to approve the increase in fees at the annual general meeting to beheld on November 24, 2008.
124
For fiscal 2008 non-executive directors received the following fees:
| | | |
| | | Annual Fee |
Board | | R118,000 annually |
Audit Committee | | R48,000 annually |
Empowerment Committee | | R32,000 annually |
Investment Committee | | R32,000 annually |
Nomination Committee | | R32,000 annually |
Remuneration Committee | | R32,000 annually |
Sustainable Development Committee | | R43,000 annually |
Technical Committee | | R60,000 annually |
Chairman of Board | | R530,000 (4.5 times the individual director’s fee) annually |
Chairman of Board committees | | Double the amount that the individual Board committee member received annually |
The terms of employment of the non-executive directors are not set out in any writtenagreements.
Share Options
AtOctober 21, 2008, our executive directors and senior management held the followingshare options, totalling less than 1% of our share capital:
| | | | | | | | | | | | | |
| | | | | | | Average | | |
| | | Number of | | Strike | | |
| Directors and | | Share | | Price | | Expiration |
| Senior Management | | Options | | (R) | | Dates |
Directors (total) | | | 91,938 | | | | 48.55 | | | | 2012-2015 | |
Senior Management (as a group) | | | 583,403 | | | | 54.00 | | | | 2012-2015 | |
Total | | | 675,341 | | | | 53.26 | | | | 2012-2015 | |
| | | | | | | | | | | | |
Optionsto purchase a total of 4,184,515 ordinary shares were outstanding onOctober 21,2008. The exercise prices of the outstanding options range between R22.90 and R91.60 per shareand they expire between 2012 and 2015. Of the outstanding options,options to purchase 675,341ordinary shares were held by our directors and senior management and those of our subsidiarycompanies, as described above. No consideration was payable on the grant of these options. See Note35 to the Consolidated Financial Statements included herein.
Shares issued in terms of the Harmony 2006 Share Plan
AtOctober 21, 2008, our executive directors and senior management held the followingshare appreciation rights and performance shares, totaling less than 1% of our share capital:
| | | | | | | | | | | | | | | | | | | | | |
| | | | | | | | | | | | | | | PS | | |
| Directors and | | Share Appreciation | | | | | | Performance Shares | | Price | | Expiration |
| Senior Management | | Rights (SAR) | | SAR Price (R) | | (PS) | | (R) | | Dates |
Frank Abbott | | | — | | | | | | | | — | | | | — | | | | — | |
Graham Briggs | | | 209,111 | | | | 78.18 | | | | 66,163 | | | | n/a | | | | 2013/2014 | |
Senior Management(as a group) | | | 542,013 | | | | 72.33 | | | | 219,546 | | | | n/a | | | | 2013/2014 | |
Share Ownership
Thefollowing sets forth, as at June 30, 2008 and at October 21, 2008, the total amountof ordinary shares directly or indirectly owned by our directors and senior management, includingshares issued under the 2006 Share Plan. Our directors and senior management do not own anypreference shares.
125
| | | | | | | | | | | | | | | | | |
| | | | | | | | | | | Ordinary | | |
| | | Ordinary | | | | | | Shares | | |
| | | Shares Number | | | | | | Number as at | | |
| | | as at | | | | | | November | | |
| Holder | | June 30, 2008 | | Percentage | | 28, 2008 | | Percentage |
Non-executive chairman | | | | | | | | | | | | | | | | |
P. Motsepe | | | — | | | | — | | | | — | | | | — | |
Directors Non-executive | | | | | | | | | | | | | | | | |
J. Chissano | | | — | | | | — | | | | — | | | | — | |
F De Buck | | | — | | | | — | | | | — | | | | — | |
Ken Dick | | | — | | | | — | | | | — | | | | — | |
Cheick Diarra | | | — | | | | — | | | | — | | | | — | |
Dr. S. Lushaba | | | — | | | | — | | | | — | | | | — | |
C. Markus | | | — | | | | — | | | | — | | | | — | |
M. Motloba | | | — | | | | — | | | | — | | | | — | |
C. Savage | | | — | | | | — | | | | — | | | | — | |
A. Wilkens | | | 203,000 | | | | | (1) | | | 203,000 | | | | | (1) |
Executive Directors | | | — | | | | — | | | | — | | | | — | |
G. Briggs | | | — | | | | — | | | | — | | | | — | |
F. Abbott | | | — | | | | — | | | | — | | | | — | |
Total Directors (12 persons) | | | 203,000 | | | | — | | | | 203,000 | | | | — | |
Employees
General
Set out below is the number of people working at each of our operations and the number atour operations who are employed by outside contractors as at the end of each of fiscal years 2008,2007 and 2006.
| | | | | | | | | | | | | | | | | | | | | | | | | |
| | | Harmony Employees at | | Outside Contractors at |
| | | June 30, | | June 30, |
| | | 2008 | | 2007 | | 2006 | | 2008 | | 2007 | | 2006 |
South Africa | | | 40,751 | | | | 47,600 | | | | 43,283 | | | | 6,309 | | | | 9,075 | | | | 5,287 | |
International | | | 862 | | | | 516 | | | | 237 | | | | 846 | | | | 350 | | | | 73 | |
Grand total | | | 41,543 | | | | 48,325 | | | | 43,724 | | | | 7,155 | | | | 9,851 | | | | 5,776 | |
These numbers show a substantial reduction in the number of both employees and of outsidecontractors which was achieved over the 9-month period ended June 30, 2008. It represents theconsequences of the restructuring program on the employee numbers (see below).
South Africa
South Africa’s underground gold mining is very labor intensive and, despite downscaling in recenttimes, the sector is still a major provider of employment in the economy of the region.
Unionized Labor
South African labor relations is characterised by a high degree of regulation, with legislationcovering:
South African labor relations is characterised by a high degree of regulation, withlegislation covering:
| | • | | minimum conditions of employment (note there is no prescribed basic minimum wage); |
| |
| | • | | trade union access and membership; |
126
| | • | | training and development; |
| |
| | • | | mandatory compensation in the event of termination for operational reasons; |
| |
| | • | | affirmative action policies and programs; |
| |
| | • | | compensation for occupational illness and injury; |
| |
| | • | | mechanisms for collective bargaining;. |
| |
| | • | | procedures for the resolution of disputes; and |
| |
| | • | | regulation of strikes and dismissals. |
In the mining industry, our relationship with the unions and the government is wellestablished and provides a structure for negotiation conditions of employment and the provision ofbenefits, including retirement benefits and heath care for employees and their dependants. Thisstructure also allows for consultation on many operational issues including for example,recruitment and selection, training and development and health and safety. We are no different fromthe other major gold producers in this regard; we fully participate, and in some instances haveplayed a major role, in the industry’s industrial relations structures, including the Chamber ofMines of South Africa (which represents the interest of the major employers in the miningsector).
The major unions present and recognized by us are the (i) National Union of Mineworkers(NUM), (ii) United Association of South Africa (UASA) and (iii) Mineworkers’ Solidarity and theSouth African Electrical Workers’ Association (SAEWA).
Set out below is the number of our employees by union membership as of June 30, 2008:
| | | | | |
• NUM | | | 77 | % |
| |
• Solidarity | | | 2 | % |
| |
• UASA | | | 9 | % |
| |
• Collective Bargaining Fund | | | 4 | % |
| |
• Other | | | 1 | % |
| |
• Un-unionised | | | 7 | % |
Approximately 1,726 employees are subject to Agency Shop arrangements (whereby the terms andconditions of service negotiated and agreed to with the recognised Trade Unions are extended toapply to non-union members who, in turn, then pay a small fee to the union) and the rest of theemployees either do not belong to a union or belong to one of the more insignificant unions activein Harmony from time to time.
As a result of our highly unionized labor force and the fact that labor costs constituteapproximately 50% of production costs, we have attempted to balance union demands with the need tocontain and reduce cash costs in order to ensure the long-term viability of our operations.
The most significant event in our employee relations during fiscal 2008 was the restructuringprogram which resulted in a substantial reduction in our employee headcount. This workforcereduction was achieved with the cooperation of all our represented unions and without anydisruption of operations. As such, while a workforce reduction of this size by an South Africancompany would normally be a sensitive issue, we were successful in engage in reductions withoutmajor operational disruptions and negative publicity. The success of this exercise is attributableto the excellent relationship that our management has cultivated with the unions over the lastthree years. Affected employees were given severance packages and many were placed in trainingprogrammes funded by the Company’s social plan.
Another key event in fiscal 2008 was the reduction in electricity supply to our mines,resulting in a halting operations and a redeployment of employees to other operations which did nothave similar electrical issues. As with our workforce reduction program, we also sought thecooperation of the unions in this matter. While this reduction of electricity supply presented somedifficulties which slowed down the redeployment process, approximately 9,095 employees of affectedsites were redeployed to other sites within our operations in fiscal 2008.
The industry wage negotiations were successfully completed in July 2007, and the unionsreached a agreement with the Chamber of Mines which provided for a better-than-inflation wageagreement (ranging from 10% for lower level semi-skilled employees down to 8.5% for the moreskilled employees). Special arrangements were also agreed to attempt to address the skills shortagein the industry and certain key job
127
categories now receive scarcity allowances of various kinds in an attempt to make the industryattractive to them.
The only group wide work stoppages were two days in July and August which were lost as part ofthe national campaign by the largest trade union federation COSATU against soaring food prices.
In November 2007, our Conops Task Team completed an internal due diligence of Conops. Theobjective of the internal due diligence exercise were to:
| | • | | establish whether Conops has been successfully implemented at themines where it was introduced and to what extent the originalobjective of improved profitability without compromising safety wasmet; |
| |
| | • | | understand the gap that exists between the current performance of theoperations and the potential performance after implementation ofConops at these operations; and |
| |
| | • | | understand the reasons for the underperformance versus the Conopspotential and propose actions to the operations to close the gap. |
Following the above exercise, action plans were produced by each shaft management team at eachoperation addressing those issues that were identified as requiring attention. After therecommended actions were implemented, progress towards operational improvement was monitored. Ourstated intention was to review these planned Conops within three months of implementation; inFebruary 2008, this review was completed, and we decided to phase Conops out at those operationswhose ore reserves, infrastructure and staffing levels did not delivery on our profitabilityobjectives.
Work Stoppages
DuringOctober 2008, a 4-day long work stoppage occurred at the Elandsrand mine nearCarletonville due to a fall of ground accident which resulted in the death of one mineworker.
During September 2008, a one day work stoppage occurred at Tshepong, in protest of minesafety, following a fatal accident in which a mineworker was killed. This work stoppage followed anagreement between our management and NUM and was limited only to Tshepong.
There were no work stoppages in fiscal 2007.
We experienced two strikes during fiscal 2006, both affected all locations. The first wasa five-day strike in August 2005 related to wage disputes. The second was a one-day national“stay-away” organized by COSATU.
We experienced a number of strikes during fiscal 2005, one an industry-wide strike andthe others mainly related to restructuring. These were all resolved in an amicable fashion. Intotal, 422,754 shifts were lost in fiscal 2005 at the South African operations as a result ofstrike action. The most significant strike was the one from March 23, 2005 to April 6, 2005 at ourFree State operations, which were mainly about housing and outsourcing issues; 277,452 shifts werelost as a result of the strike.
Australia
Employee relations in Australia are regulated by a combination of federal and statestatutes that stipulate minimum standards and provide for collective bargaining and action. Allemployment contracts are based on Australian Workplace Agreements. Our Australian workforce is notunionized.
PNG
Employee relations in PNG are regulated by the Employment Act of 1978 (PNG) and theEmployment of Non-Citizens Act 1978 (PNG). Individual contracts are entered into, and the workforceis not unionized.
The workforce comprises both expatriates and national citizens, with most working afly-in fly-out roster.
Long Term Incentive Schemes
In addition to employees’ annual salaries, Harmony has implemented various share optionschemes, including the Harmony 2006 Share Plan. In all, 14% of Harmony’s share capital is reservedfor long- term incentive schemes, which were approved by shareholders at the annual general meetingheld in November 2005.
Existing share option schemes
Harmony has two share option schemes, namely the 2001 Share Option Scheme and the 2003 ShareOption Scheme (collectively), which all have similar rules. Since the implementation of the 2006Share Plan, no options have been nor will be issued in terms of the existing schemes.
128
Optionsgranted before the implementation of the 2006 Share Plan remain open for acceptance for 10 years after the date of grant, subject to theterms of the relevant option scheme.
A share purchase trust was established in 2002 which is controlled by Harmony. Recourse loansare provided by the trust to employees to enable them to acquire shares or exercise their optionsunder Share Option Schemes. Since March 27, 2003, share option scheme participants are no longerallowed to place their shares in the share purchase trust.
The share purchase trust is funded by a loan from Harmony, which it repays once it receivesrepayment of the recourse loans granted to employees. Members of the Remuneration Committee serveas trustees. The trustees are not eligible to receive loans from the trust. Participants are notallowed to use structures to lock-in profits as the options are meant to align employees with ourshareholders.
Broad-Based Employee Scheme
The total number of shares to be reserved for the Broad-Based Scheme will be 5% of ourcurrent issued share capital, subject to certain employee performance linked milestones which canbe realistically achieved. Once achieved, the value is unlocked to the Broad-Based Scheme for theultimate benefit of the non-managerial employees. The company intends to structure the Broad- BasedScheme so as to maximise the recognition of black participants therein, both from the perspectiveof the MPRDA and the Broad-Based Black Economic Empowerment Act. Discussions relating to optionbenefits for non- managerial employees are ongoing with unions representing these employees.
The Harmony 2006 Share Plan
The Harmony 2006 Share Plan (the plan) was adopted by shareholders at the annual generalmeeting held on 10 November 2006. The plan incorporates the following elements: equity- settledshare appreciation rights, performance shares and performance allocated restricted shares. The Planis in line with global best practice and emerging South African practice, which in combinationserves to reward the required attributes of shareholder alignment and long- term, sustainedperformance.
In terms of the Plan, executive directors and senior employees of Harmony and itssubsidiaries and associates are awarded rights to receive shares in Harmony, based on the value ofthese awards when time and performance conditions have been met, the awards have vested and, inthe case of the Share Appreciation Rights (SARs), the restricted shares, have been exercised.
The primary intent of the Plan is to reward executives and senior management for longterm, sustained performance achievements which are aligned to shareholder value, and at the sametime to ensure an optimal positioning in terms of the accounting and regulatory environment.
It is envisaged that rewards will be settled in shares. The nature of the Plan, which islinked to performance conditions, is not as dilutive as a normal share option scheme.
Annual allocations of SARs awards of performance shares and grants of restricted shares aregoverned by Harmony’s reward philosophy, in which (inter alia) the ‘expected value’ of long- termincentive rewards is set for defined categories of executives and senior management. The expectedvalue is defined as the present value of the future reward outcome of an allocation/award/grant,given the targeted future performance of Harmony and its share price.
Annual incentive scheme
Our Remuneration Committee ensures that our directors and senior executives are fairlyrewarded for their individual contributions to our overall performance.
In September 2006, the Remuneration Committee approved an annual incentive scheme as part ofHarmony’s Reward Philosophy to benefit executive directors and members of management.
129
Item 7. MAJOR SHAREHOLDERS AND RELATED PARTY TRANSACTIONS
Major Shareholders
We are an independent gold producer, with no single shareholder exercising control. As ofOctober 21, 2008, our issued share capital consisted of 403,437,257 ordinary shares. To ourknowledge, (A) we are not directly or indirectly owned or controlled (i) by another corporation or(ii) by any foreign government and (B) there are no arrangements (including any announced orexpected takeover bid), the operation of which may at a subsequent date result in a change in ourcontrol.
The voting rights of our major shareholders do not differ from the voting rights of otherholders of the same class of shares.
Significant changes in the percentage ownership held by major shareholders in the pastthree years are described below on “Related Party Transactions”.
Alist of the 5% holders of our securities as of October 21, 2008 is set forth below:
| | | | | | | | | |
| | | Number of | | |
| Holder | | Shares | | Percentage |
1. Allan Gray | | | 74,729,579 | | | | 18.60 | % |
2. ARM Ltd. (2) | | | 63,632,922 | | | | 15.84 | % |
3. Blackrock Investment Management (UK) Ltd. | | | 33,069,140 | | | | 8.231 | % |
4. Orbis Investment Management Ltd. (3) | | | 21,029,121 | | | | 5.23 | % |
| | |
| (1) | | Depository with respect to the ADRs held on the U.S. register. |
| |
| (2) | | Patrice Motsepe, our Chairman, has an indirect holding in ARM Limited. |
| |
| (3) | | Depository with respect to our International Depository Shares. |
The voting rights of our major shareholders do not differ from the voting rights of otherholders of the same class of shares.
Asof October 21, 2008, there were 114 record holders holding31,179,062 ADSsoutstanding, which accounted for 7.73% of our ordinary shares. There were a total of110,052,632 ADRs outstanding as of the same date, representing 27% of our share capital.
Related Party Transactions
None of our directors or major shareholders or, to our knowledge, their families, had anyinterest, direct or indirect, in any transaction since July 1, 2005, or in any proposed transactionthat has affected or will materially affects us or our subsidiaries, other than as stated below.
On July 11, 2008, we sold our 37.8% share in Village Main Reef Gold Mining Company (1934)Limited for R1.1 million to The Point Investments. ZB Swanepoel, our former Chief ExecutiveOfficer, is a director and founder of The Point Investments.
On February 27, 2008, the Group sold its Orkney assets to Pamodzi in exchange for shares,whereby it obtained an interest of 32.4% and Pamodzi became an associate (refer to note 20).Subsequent to this, we provided goods and services to Pamodzi at cost plus an applicable margin asset out in the service level agreement. The balance of the unsecured loan at June 30, 2008 was R103million (U.S.$13.2 million). The terms of the loan are being renegotiated, with payment expectedwithin two years. Interest is charged at prime rate; however should an event of default occur therate will be Prime plus 2%.
ARM Limited currently holds approximately 16% of our shares. Patrice Motsepe, André Wilkensand Frank Abbott are directors of ARM Limited.
In Fiscal 2005, as part of the disposal of our investment in ARM Limited to the ARMBroad-based Economic Empowerment Trust (“BEE Trust”), various agreements were put in place to whichwe accepted and resulted in the majority of the risk not being transferred away from us. Includedin these agreements were two guarantees by us to Nedbank relating to the loans obtained by the BEETrust to acquire the shares from us. On September 28, 2008, the guarantees were cancelled byNedbank and, consequently, we have no further obligation toNedbank in this regard. The ARM investment (and associated Nedbank loan) have been derecognisedfrom this date.
130
On June 6, 2006, the put-and-call option was cancelled and replaced with a guarantee byus in respect of the first loan, subject to a maximum guaranteed amount of R367.4 million(U.S.$50.4 million) plus interest thereon at the applicable funding rate from May 26, 2006. As aresult, we continue to consolidate the ARM Empowerment Trust in our financial statements. Inaddition, if the ARM Empowerment Trust chooses to dispose of 8,175,640 ARM Limited shares at cost,the maximum guaranteed amount will be reduced to R214.9 million (U.S.$29.5 million) plus interestthereon at the applicable funding rate from May 26, 2006. We have also entered into an indemnityagreement with ARM Limited, according to which ARM Limited agreed to indemnify us against 50% ofall claims against us under the guarantee, subject to a maximum of R107.4 million(U.S.$14.7 million) plus interest thereon at the applicable rate from May 26, 2006. OnSeptember 28, 2007, the guarantee was cancelled by the Bank, and we have no further obligation inthis regard.
In March 2006, we acquired 37.37 million of the 44.99 million shares held in WesternAreas Limited from Allan Gray Ltd. As at June 30, 2008 Allan Gray Ltd was one of our largestshareholders, holding 11% of our total shares. Allan Gray Ltd currently holds approximately 13% ofHarmony.
On June 21, 2006, we announced that we had acquired 37.8% of the issued share capital ofVillage Main Reef Gold Mining Company (1934) Limited (“Village”) for an amount of R458,775(U.S.$64,178). The equity stake was purchased from ARM Limited at a price of 20 cents per share.Due to the fact that the acquisition surpasses the 35% mark, we were obliged under the SecuritiesRegulation Code on Takeovers and Mergers to extend an offer to the remaining shareholders ofVillage to acquire all of their shares at the same price at which it acquired the 37.8% stake. OnAugust 14, 2006, we announced that minority shareholders holding 3,163 shares in Village (being8.38% of the shares in respect of which the offer was made) had accepted our offer. At June 30,2008, we held 2,295,663 shares representing 37.83% of the issued share capital of Village. OurChairman, Patrice Motsepe, is also a member of ARM Limited’s board of directors. Frank Abbott wasalso a director of Village at the time of the purchase. During July 2008, Harmony’s shareholding inVillage was sold to Bernard Swanepoel, a former director of Harmony.
INTERESTS OF EXPERTS AND COUNSEL
Not applicable.
131
Item 8. FINANCIAL INFORMATION
CONSOLIDATED STATEMENTS
Please refer to Item 18. “Financial Statements” of this annual report.
Legal Proceedings
None of our properties is the subject of pending material legal proceedings. We haveexperienced a number of claims and legal and arbitration proceedings incidental to the normalconduct of our business, such as the ones described below. The directors, however, do not believethat liabilities related to such claims and proceedings are likely to be, individually or in theaggregate, material to the company’s consolidated financial condition.
Class Actions
We have been made aware of a pending class action in the United States whereby certain ADRholders are seeking damages against us pertaining to our business practices. We have retainedlocal legal counsel to advise on the matter.
Dividends and Dividend Policy
We paid interim and final dividends on our ordinary shares in 2003 and 2004. Due tooperating conditions and our commitment to expenditure on long-term growth projects, we were notable to declare any dividends in fiscal 2005, fiscal 2006, fiscal 2007 or fiscal 2008. Forinformation on our accounting policy relating to dividends, see note 2(w) to the consolidatedfinancial statements.
South African law was relaxed to permit the distribution of a company’s equity as adividend, provided that the necessary shareholder or board approval is obtained and, after thedistribution of the dividend, the company remains solvent and liquid. Cash dividends, however, mayonly be paid out of accumulated profits or other distributable reserves. Previously under SouthAfrican law, a company’s equity could not be distributed as a dividend. The amount of dividends, ifany, paid in the future will depend on our results of operations, financial condition, cashrequirements and other factors deemed relevant by the Board.
Recent Developments
Hidden Valley joint venture partnership
On July 16, 2008, the conditions precedent were finalized for the transaction with Newcrest,which included regulatory and statutory approvals by the PNG Government. Completion of Stage 1 hasoccurred, with an effective date of July 31, 2008.
A total consideration for completion of Stage 1 of U.S.$229 million was received, of whichU.S.$50 million has been placed in a jointly controlled escrow account. This amount wassubsequently released to us following the confirmation of an exploration licence approval by thePNG Mining Authorities.
Sale of Mount Magnet
Duringfiscal 2008, we entered into an agreement with Monarch Gold for the sale of our Mount Magnetoperations. However, subsequent to year-end, we were advised thatMonarch Gold had placed itself in voluntary administration and, on August1, 2008, the Administrator indicated that Monarch Gold will not proceedwith the proposed purchase and consequently the purchase agreementhas been terminated. We received from Monarch Gold a deposit of A$5million of which A$2.5 million has been refunded and A$2.5 millionhas been recorded asrevenue. We have resumed management of the operation and havere-commenced the sale process. The assets are now under care andmaintenance.
The pricein the binding purchase agreement with Monarch Gold, together with othercompetitive bids received at the time, was considered to be the bestevidence of the fair value less cost to sell of the Mount Magnetoperations at June 30, 2008. Due to the significant changes ineconomic circumstances that occurred after July 1, 2008, includingthe availability and cost of funding to a potential buyer, managementobtained an external indicative valuation in October 2008 and updatedtheir estimate of the fair value less costs to sell of the MountMagnet operations. Based on these estimates, the fair value less costs to sell decreasedby approximately US$18.3 million in the periodsubsequent to June 30, 2008. As a result, we recognized additionalimpairments of our non-current assets held for sale in the September 2008quarter.
132
Village Main Reef
During July 2008, we entered into a sale of shares agreement with To The Point GrowthSpecialists Investments 2 (Proprietary) Limited (“To The Point”) in terms of which we sold our37.8% shareholding in Village to To The Point, acquiring 2,295,663 shares of 12.5 cents each, fullypaid up, for a purchase consideration of R1.1 million.
RandUranium
OnDecember 19, 2007, we announced that we had entered into an agreement with Pamodzi ResourcesFund 1, LLP (“PRF”) for the sale of our gold and uranium assets at the Cooke operations to aspecially formed Company, Rand Uranium, of which PRF would own 60% ofthe issued share capital.
Arevised purchase consideration of US$348 million has been agreed upon. We will receive US$209million for the sale of the 60% portion of Rand Uranium to PRF, ofwhich US$40 million will be payable on theeffective date (November 21, 2008), US$157 million, plus interest thereon at 5% per annum, on April22, 2009 and the balance of the purchase consideration on completion of stage two. Stage two ofthe transaction relates to the old Randfontein assets and is expected to be finalized on orshortly after April 22, 2009.
PRF’sinvestors, affliates of First Reserve Corporation and AMCI Capital LP, have providedus with a guarantee inrespect of the above amounts. In addition, PRF will pledge its shares in Rand Uranium to us assecurity for PRF’s obligation to pay the purchase consideration.
133
Item 9. THE OFFER AND LISTING
MARKETS
Stock Exchange Listings and Ticker Codes
The primary listing of our ordinary shares is on the JSE Limited. Our ordinary shares are alsolisted on stock exchanges in London and Berlin, as well as being quoted in Brussels, Paris andLuxembourg in the form of International Depositary Receipts (IDRs) and on the New York StockExchange and NASDAQ in the form of American Depositary Shares (ADSs).
| | | |
JSE Limited | | HAR |
New York Stock Exchange | | HMY |
NASDAQ | | HMY |
London Stock Exchange | | HRM |
Euronext Brussels | | HG |
Euronext Paris | | HMY |
Berlin Stock Exchange | | HAM1 |
OFFERING AND LISTING DETAILS
The high and low sales prices in Rand for our ordinary shares on the JSE for the periodsindicated were as follows:
| | | | | | | | | |
| | | Harmony Ordinary |
| | | Shares |
| | | (Rand per Ordinary |
| | | Share) |
| | | High | | Low |
Fiscal year ended June 30, 2006 | | | | | | | | |
First Quarter | | | 71.99 | | | | 46.62 | |
Second Quarter | | | 88.35 | | | | 65.50 | |
Third Quarter | | | 117.05 | | | | 76.00 | |
Fourth Quarter | | | 114.21 | | | | 80.51 | |
Full Year | | | 117.05 | | | | 46.62 | |
Fiscal year ended June 30, 2007 | | | | | | | | |
First Quarter | | | 121.54 | | | | 86.10 | |
Second Quarter | | | 123.00 | | | | 101.00 | |
Third Quarter | | | 113.45 | | | | 90.85 | |
Fourth Quarter | | | 117.85 | | | | 94.30 | |
Full Year | | | 123.00 | | | | 86.10 | |
Fiscal year ended June 30, 2008 | | | | | | | | |
First Quarter | | | 104.05 | | | | 60.00 | |
Second Quarter | | | 83.05 | | | | 63.00 | |
Third Quarter | | | 118.50 | | | | 69.00 | |
Fourth Quarter | | | 104.41 | | | | 82.98 | |
Full Year | | | 118.52 | | | | 60.00 | |
Month of | | | | | | | | |
July 2008 | | | 99.00 | | | | 75.10 | |
August 2008 | | | 80.49 | | | | 56.45 | |
September 2008 | | | 87.78 | | | | 52.10 | |
As ofOctober 21, 2008 | | | 92.74 | | | | 88.00 | |
On June 30, 2008, the share price of our ordinary shares on the JSE was R95.00.
Our ADRs are dual-listed on the New York Stock Exchange and, as of November 29, 2005, on theNASDAQ. The high and low sales prices in U.S. dollars for our ADRs for the periods indicated, asreported on the NYSE and NASDAQ, were as follows:
134
| | | | | | | | | | | | | | | | | |
| | | NYSE | | NASDAQ |
| | | Harmony ADRs | | Harmony ADRs |
| | | ($ per ADR) | | ($ per ADR) |
| | | High | | Low | | High | | Low |
Fiscal year ended June 30, 2006 | | | | | | | | | | | | | | | | |
First Quarter | | | 11.23 | | | | 7.21 | | | | 11.06 | | | | 7.20 | |
Second Quarter | | | 13.64 | | | | 9.71 | | | | 13.64 | | | | 9.71 | |
Third Quarter | | | 18.84 | | | | 12.25 | | | | 18.84 | | | | 12.25 | |
Fourth Quarter | | | 17.76 | | | | 11.90 | | | | 17.76 | | | | 11.90 | |
Full Year | | | 18.84 | | | | 7.21 | | | | 18.84 | | | | 7.21 | |
Fiscal year ended June 30, 2007 | | | | | | | | | | | | | | | | |
First Quarter | | | 17.10 | | | | 11.91 | | | | 17.10 | | | | 11.91 | |
Second Quarter | | | 17.26 | | | | 12.81 | | | | 17.26 | | | | 12.81 | |
Third Quarter | | | 15.97 | | | | 12.80 | | | | 15.97 | | | | 12.80 | |
Fourth Quarter | | | 16.70 | | | | 13.15 | | | | 16.70 | | | | 13.15 | |
Full Year | | | 16.76 | | | | 12.67 | | | | 16.76 | | | | 12.67 | |
Fiscal year ended June 30, 2008 | | | | | | | | | | | | | | | | |
First Quarter | | | 15.27 | | | | 8.42 | | | | 15.27 | | | | 8.41 | |
Second Quarter | | | 11.90 | | | | 9.35 | | | | 11.90 | | | | 9.35 | |
Third Quarter | | | 14.56 | | | | 9.34 | | | | 14.56 | | | | 9.34 | |
Fourth Quarter | | | 13.20 | | | | 10.45 | | | | 13.20 | | | | 10.45 | |
Full Year | | | 15.27 | | | | 8.42 | | | | 15.27 | | | | 8.74 | |
Month of | | | | | | | | | | | | | | | | |
July 2008 | | | 12.65 | | | | 10.26 | | | | 12.70 | | | | 10.76 | |
August 2008 | | | 10.67 | | | | 7.22 | | | | 10.22 | | | | 7.22 | |
September 2008 | | | 10.74 | | | | 6.38 | | | | 10.77 | | | | 6.39 | |
As ofOctober 21, 2008 | | | 10.43 | | | | 9.82 | | | | 10.43 | | | | 9.80 | |
OnOctober 21, 2008, the closing share price of our ordinary shares on the NYSE wasU.S.$7.13.
OnOctober 21, 2008, the closing share price of our ordinary shareson NASDAQ was U.S.$7.13.
THE SECURITIES EXCHANGE IN SOUTH AFRICA
The JSE is the sixth largest emerging market exchange and by far the leading exchange inAfrica, playing a leadership role in the continent, supporting South Africa’s role as the Africanfinancial hub. It is also recognized as a leading exchange in the global resources sector.
As South Africa’s only full service securities exchange, the JSE connects buyers and sellersin five different markets; equities, which includes a primary and secondary board, equityderivatives, agricultural derivatives and interest rate instruments. The JSE is one of the top 20exchanges in the world in terms of market capitalisation.
The JSE is the market of choice for local and international investors looking to gain exposureto the leading capital markets in South Africa and the broader African continent.
History
The Securities Exchange in South Africa, now known as JSE Limited, was formed in November1887. In 1993 the JSE became an active member of the African Stock Exchanges Association. On May15, 1996, the formal bond market passed from the JSE to the Bond Exchange of South Africa and isseparately licensed as a financial market in terms of the Financial Markets Control Act.
Following the closure of the open outcry trading floor on June 7, 1996, an order driven,centralized automated trading system known as the JSE Equities Trading, or JET, system wasintroduced together with dual trading and negotiated brokerage. On August 18, 1997, the Listingsdivision of the JSE introduced a real time news service for the dissemination of companyannouncements and price sensitive information. SENS (Stock Exchange News Service) ensures early,equal and wide dissemination of all information that is expected to have an effect on the prices ofsecurities that trade on the JSE. In 1998, the JSE introduced an Internet-based Service, theEmerging Enterprise Zone, or the EEZ, to match seekers and providers of capital for small andmedium business. In November 1999, the electronic clearing and settlement system,
135
STRATE (ShareTransactions Totally Electronic) was introduced and the JET system was modified to prepare for theimplementation of an open interface to the system via the Application Program Interface. TheAlternative Exchange, known as the “AltX”, aimed at attracting smaller companies to the JSE, waslaunched in October 2003 and at September 30, 2007 boasts 60 listings with more companies due tolist by the end of 2007. Yield-X, which trades spot and derivative interest rate products acrossthe yield curve on an automated central order book was introduced in February 2005. The JSE’sSingle Stock Futures market is the world leader in terms of contracts traded, according to theWorld Federation of Exchanges’ IOMA Derivative Markets Survey. Concurrent with its loss oftax-exempt status on July 1, 2005, the JSE Securities Exchange South Africa de-mutualized, endingits 118 year history as a tax-exempt, member owned, voluntary association to become JSE Limited, apublic but unlisted company. Liquidity on the JSE has grown from 5% in 1996 to more than 40% bySeptember 30, 2007. The market capitalization of the JSE equities market was U.S.D777,4 million atAugust 31, 2007, with the JSE ranking as the 19th largest stock exchange in the world.
The JSE is a fully integrated exchange, which over the last few years has successfullybroadened the range of products offered. Historically the JSE derived most of its revenue from theequities market (100% in 2000). However, new products such as derivatives, fixed interest rateproducts, exchange traded funds, agricultural products and information products has reduced theJSE’s reliance on equities (71.5% equities, 17.6% agricultural products and 10.9% financialderivatives in 2004). Turnover in terms of value of equities traded on the JSE increased during2005/2006 despite the fall in the number of listed companies. Liquidity on the JSE (measured byreference to the total market value of securities traded as a percentage of the total marketcapitalization) as at September 30, 2007 was 43.2%. At that date there were 340 companies listed onthe JSE.
STRATE Settlement
Under STRATE there are essentially two types of clients: controlled and non-controlled. Acontrolled client is one who elects to keep his shares and cash with his broker and these sharesare held in custody at the broker’s chosen Custodian Bank, the CSDP. A non-controlled client is onewho appoints his own CSDP to act as custodian on his behalf. Equity settlements take place on acontractual T+5 (where T= trade date) settlement cycle. Securities and funds become due forsettlement a set number of business days after the trade. Contractual settlement is a marketconvention embodied in the rules of the JSE which states that a client has a contractual obligationto cause a JSE trade to settle on settlement day. The JSE, in its capacity as Settlement Authority,ensures that all on-market trades entered into by two JSE member firms settle five days after thetrade date.
PLAN OF DISTRIBUTION
Not applicable.
SELLING SHAREHOLDERS
Not applicable.
DILUTION
Not applicable.
EXPENSES OF THE ISSUE
Not applicable.
136
Item 10. ADDITIONAL INFORMATION
SHARE CAPITAL
Not applicable.
MEMORANDUM AND ARTICLES OF ASSOCIATION
This section summarizes certain material provisions of Harmony’s Memorandum and Articlesof Association, the Companies Act and the JSE listings requirements, each as currently in effect.These descriptions do not purport to be complete and are qualified in their entirety by referenceto all of the provisions of those sources. Directions on how to obtain a complete copy of Harmony’sArticles of Association are provided under “— Documents on Display” below.
General
We are a public company with limited liability, and is registered under the Companies Actwith the Registrar of Companies, Department of Trade and Industry under Registration number1950/038232/06. We are governed by our Memorandum of Association and Articles of Association, theprovisions of the Companies Act and the various Listings Requirements. Our operations are alsosubject to various laws and regulations, including those described in Item 4. “Information on theCompany Regulation”.
Objects and Purposes
Our objects are set forth in Paragraph 3 of our Memorandum of Association and include:
| | • | | to acquire by purchase, cession, grant, lease, exchange or otherwiseany movable or immovable property, mines, mineral property, claims,mineral rights, mining rights, mining leases, mining titles,mynpachts, lands, farms, buildings, water rights, concessions, grants,rights, powers, privileges, surface rights of every description,servitudes or other limited rights or interests in land and mineralcontracts of every description; and any interest therein and rightsover the same; and to enter into any contract, option or prospectingcontract in respect thereof, and generally to enter into anyarrangement that may seem conducive to our objects or any of them; |
| |
| | • | | to carry out all forms of exploration work and in particular to searchfor, prospect, examine, explore and obtain information in regard tomines, mineral properties, claims, mineral rights, mining rights,mining leases, mining titles, mynpachts, mining districts or locationsand ground and soil supposed to contain or containing precious stones,minerals or metals of every description; |
| |
| | • | | to open, work, develop and maintain gold, silver, diamond, copper,coal, iron and other mines, mineral and other rights, properties andworks, and to carry on and conduct the business of raising, crushing,washing, smelting, reducing and amalgamating ores, metals, mineralsand precious stones, and to render the same merchantable and fit foruse and to carry on all or any of the businesses of miners,mineralogists, metallurgists, amalgamators, geophysicists, smelters,quarry owners, quarrymen and brickmakers; |
| |
| | • | | to buy, sell, refine and deal in bullion, specie, coin and preciousand base metals, and also precious stones and other products ofmining; and |
| |
| | • | | to employ and pay mining experts, agents and other persons,partnerships, companies or corporations, and to organize, equip anddispatch expeditions for prospecting, exploring, reporting on,surveying, working and developing lands, farms, districts, territoriesand properties in any part of the world, whether the same are ourproperty or otherwise. |
Directors
Disclosure of Interests
A Harmony director may not vote in respect of any contract or arrangement in which he orshe is interested, and may not be counted in the quorum for the purpose of any resolution regardingsuch a contract or arrangement. This restriction does not apply, however, to:
| | • | | any arrangement for giving the director a security or indemnity in respect of moneylent, or an obligation undertaken, by such director for our benefit; |
137
| | • | | any arrangement by which we give any security to a thirdparty in respect of our debt or obligation for which the directorhimself or herself has assumed responsibility, in whole or in part,whether under a guarantee or indemnity or bythe deposit of a security; |
| | • | | any contract by the director to subscribe for or underwrite our shares or debentures; |
| |
| | • | | any contract or arrangement with a company other than us, in which the directorholds or controls, directly or indirectly, no more than 1% of shares representingeither (i) any class of the equity share capital of that company or (ii) the overallvoting rights of that company; or |
| |
| | • | | any retirement scheme or fund which relates to both directors and to employees (or aclass of employees) and does not accord to any director, as such, any privilege oradvantage not generally accorded to the employees to which such scheme or fundrelates. |
The restrictions preventing directors from voting in respect of contracts or arrangementin which they are interested may be suspended or relaxed at any time, either generally or inrespect of particular circumstances, by the holders of 75% our ordinary shares who are present andvoting in a general meeting.
A director, notwithstanding his of her interest, may be counted in the quorum present atany meeting where: (i) he or she or any other director is appointed to hold any office or positionof profit in Harmony; (ii) the directors resolve to exercise any of our rights to appoint, orconcur in the appointment of, a director to hold any office or position of profit in any othercompany; or (iii) the terms of any such appointment are considered or varied. At this meeting, eachdirector may vote on the matters listed above, but no director may vote in respect of his or herown appointment, or the arrangement or variation of the terms of his or her own appointment.
The restrictions described above do not prevent or debar any director, as a holder of anyclass of our shares, from taking part in or voting upon any question submitted to a vote by thatclass at a general meeting, regardless of that director’s personal interest or concern.
Compensation
The remuneration of our directors in their capacity as directors, including fees perdirectors meeting, and additional compensation for the performance of other services, such asserving on committees, may be established either by a majority of the holders of our ordinaryshares, present and voting in a general meeting, or by a majority of disinterested directors at ameeting of directors, provided they constitute a quorum.
Borrowing Powers
Our directors may raise, borrow or secure the payment of any sums of money for ourpurposes as they see fit. However, without the consent of a majority of the holders of our ordinaryshares present and voting in a general meeting, the aggregate principal amount outstanding inrespect of monies raised, borrowed or secured by us and any of our subsidiaries may not exceed thegreater of (i) R40 million or (ii) the aggregate amount, from time to time, of our issued and paidup capital, plus the aggregate of the amounts standing to the credit of all distributable andnon-distributable reserves, plus our share premium account and the share premium accounts of oursubsidiaries.
The Companies Act provides that a company may only make a loan to its owner, director ormanager with the prior consent of all the members of the company or pursuant to a specialresolution relating to a specific transaction.
Rotation
At each of our annual general meetings, one-third of the directors, or, if the number isnot a multiple of three, then the number nearest to but not exceeding one-third, shall retire fromoffice by rotation. Those directors who have been longest in office since their last election orre-election shall retire. As between directors of equal seniority, the directors to retire byrotation shall, in the absence of agreement, be selected by lot. If at the date of any annualgeneral meeting, any director shall have held office for a period of at least three years since hisor her last election or re-election, he or she shall retire at such meeting, either as one of thedirectors resigning pursuant to the aforementioned rotation principles, or in addition thereto. Atthe next general meeting of shareholders, Mr P. Abbott and Mr. CML Savage are due to retire byrotation. Retiring directors are eligible for re-election and said directors have made themselvesavailable for re-election.
If a director is appointed to any Harmony executive office, his or her employmentcontract may provide that he or she shall be exempt from rotation for the lesser of (i) a period of5 years or (ii) the period during which he or she continues to hold the relevant executive office.During the relevant period, the director in question shall not be taken into account in determiningthe retirement of directors by rotation. The number of directors who may be exempt from retirementby rotation in this manner shall not equal or exceed one-half of the total number of the directorsat the time of the relevant director’s appointment. Currently none of our directors are exemptedfrom retirement under these provisions.
138
Qualifications
There is no age limit requirement with regard to retirement or non-retirement ofdirectors. Directors are not required to hold any of our shares to qualify them for appointment asdirectors.
Share Capital
As of June 30, 2008, our issued share capital consisted of 403,253,756 ordinary shareswith a par value of R0.50 each. As of October 21, 2008, our issued share capital consisted of403,437,257 ordinary shares with a par value of R0.50 each. At the general meeting held onNovember 12, 2004, our authorized share capital was increased from 450,000,000 ordinary shares witha par value of R0.50 to 1,200,000,000 ordinary shares with a par value of R0.50 each. The terms ofthe ordinary shares are described in “— Description of Ordinary Shares” below.
Description of Ordinary Shares
This section summarizes the material provisions of Harmony’s ordinary shares as set outin Harmony’s Memorandum and Articles of Association, the Companies Act and the JSE listingsrequirements, each as currently in effect. It does not purport to be complete and is qualified inits entirety by reference to all of the provisions of those sources.
Dividends
Either the Board or a majority of the holders of our ordinary shares, voting in a generalmeeting, may, from time to time, declare a dividend to be paid to the registered holders ofordinary shares according to their respective rights and interests in the profits, measured inproportion to the number of ordinary shares held by them. Under South African law, a company’sequity may be distributed as a dividend, provided that any necessary shareholder approval isobtained and, after the distribution of the dividend, the company remains solvent and liquid. Cashdividends, however, may only be paid out of the profits of the company. Cash dividends paid by uswill not bear any interest payable by us. Dividends may be declared either free of, or subject to,the deduction of income tax and any other tax or duty which may be chargeable. There is currentlyno tax payable in South Africa by the recipients of dividends who are outside South Africa.
Dividends are declared payable to holders of ordinary shares who are registered as suchon a record date determined by the Board, which must be after the later of the date of the dividenddeclaration or the date of confirmation of the dividend. The period between the record date and thedate of the closing of the transfer registers in respect of the dividend shall be not less than 14days.
Holders of our ordinary shares, voting in a general meeting, may not declare a dividendgreater than the amount recommended by the directors, but may declare a smaller dividend. Dividendswill be paid to the holders of our ordinary shares in proportion to the number of their shares. Allunclaimed dividends may be invested or otherwise utilized by the Board for our benefit untilclaimed; provided that dividends unclaimed after a period of twelve years from the date ofdeclaration may be declared forfeited by the Board. Forfeited dividends revert to us.
Any dividend or other sum payable in cash to a holder may be transmitted by a paymentmethod determined by the directors, such as electronic bank transfer or ordinary post to theaddress of the holder recorded in the register or any other address the holder may previously havegiven to us in writing. We will not be responsible for any loss in transmission.
Any dividend may be paid and satisfied, either wholly or in part, by the distribution ofspecific assets, including shares and debentures of any other company, in cash, or by one or moreof such methods, as the Board may determine and direct at the time of the dividend declaration.
When any holders of our ordinary shares reside outside of South Africa, the Board has thepower, subject to any applicable laws or regulations, to declare a dividend in a relevant currencyother than the Rand and to determine the date on which and the rate of exchange at which thedividend shall be converted into the other currency.
All cash dividends paid by us are expected to be in Rand. Holders of ADRs on the relevantrecord date will be entitled to receive any dividends payable in respect of the ordinary sharesunderlying the ADRs, subject to the terms of the Deposit Agreement. Cash dividends paid in Randwill be converted by the depository to U.S. dollars and paid by the depository to holders of ADRs,to the extent it can do so on a reasonable basis and can transfer the U.S. dollars to the UnitedStates, net of conversion expenses of the depository, and in accordance with the Deposit Agreement.
139
Voting Rights
Subject to any rights or restrictions attached to any class of ordinary shares, everyholder of our ordinary shares who is present in person at a shareholder meeting, or a personpresent as a representative of holders of one or more ordinary shares, shall on a show of handshave one vote, irrespective of the number of ordinary shares he holds or represents. Every holderof ordinary shares shall, on a poll, have one vote for every ordinary share held by him. Ashareholder is entitled to appoint a proxy to attend and speak and vote at any meeting on his orher behalf. The proxy need not be a shareholder. On a poll, a shareholder entitled to more than onevote (or his representative, proxy or agent) need not, if he votes, use all of his votes or castall of his votes in the same way.
Distribution of Assets on Liquidation
In the event of voluntary or compulsory liquidation, dissolution or winding up, theassets remaining after payment of all our debts and liabilities, including the costs ofliquidation, will be applied to repay the amount paid up on our issued capital to holders of ourordinary shares and, thereafter, the balance will be divided pro rata among the holders of ourordinary shares, subject to any special rights or conditions attaching to any shares. Any portionof our assets may, upon such liquidation, dissolution or winding up, and with the approval of aspecial resolution, be paid to the ordinary shareholders by the distribution of specific assets ormay be vested in trustees for the benefit of such ordinary shareholders.
Redemption/Purchase of Shares
No shares shall be issued which are redeemable by their terms or at the option of anyparty.
The Companies Act permits companies to establish share incentive trusts and provide fundswith which such trusts may purchase securities (including debt and equity securities) of a companyor its holding company. These securities are to be held by or for the benefit of employees,including salaried directors. The Companies Act also permits such a trust to loan funds to companyemployees for the purpose of purchasing or subscribing for our securities, provided that suchtrusts may not loan funds to directors who do not hold salaried employment or office.
The Companies Amendment Act provides that, with effect from June 1, 1999, a company mayapprove the acquisition of its own shares by special resolution, if authorized to do so by itsarticles. A company is not, however, permitted to make any form of payment to acquire any of itsown shares if there are reasonable grounds for believing that the company is or, after the payment,would be unable to pay its debts or if, after the payment, the consolidated assets of the companyfairly valued would be less than the consolidated liabilities of the company. The procedure foracquisition of shares by a company is regulated, in the case of listed companies, both by theCompanies Amendment Act and the Listings Requirements of the JSE. The Companies Amendment Actfurther provides that a company may make payments to its shareholders if authorized by its articlessubject to the liquidity and solvency requirements described above.
WE are authorized pursuant to our Articles of Association to approve the acquisition ofour shares by special resolution from time to time. We are also authorized pursuant to our Articlesof Association to make payments in cash or in specie to any class of our shareholders.
Issue of Additional Shares and Pre-emptive Rights
The Companies Act does not provide holders of any class of our shares with pre-emptiverights. However, the JSE requires that any new issues of equity shares by companies listed on theexchange must first be offered to existing holders of such shares, in proportion to their currentholding.
The JSE will, however, allow a company to issue shares to third parties without firstoffering them to existing shareholders, in circumstances such as the following:
| | • | | pursuant to an employee share incentive scheme the terms of which havebeen approved by the holders of the relevant class of shares in ageneral meeting; |
| |
| | • | | for the acquisition of an asset, provided that if the issue is morethan 30% of the company’s issued share capital, a simple majority ofholders of ordinary shares present and voting, must vote in favor ofthe acquisition; |
| |
| | • | | to raise cash by way of a general issue in the discretion of thedirectors (but not to related parties) of up to 15% of the issuedshare capital in any one fiscal year at an issue price with a discountnot exceeding 10% of the 30-day weighted average trading price priorto the determination date, provided that the holders of ordinaryshares, present and voting at a general meeting, must approve thegranting of such authority to the directors by a 75% vote; or |
140
| | • | | to raise cash by way of a specific issue of a specified number or amaximum number of shares for cash provided that the holders ofordinary shares, other than controlling shareholders, present andvoting, vote in favor of the resolution to issue the shares at ageneral meeting by a 75% vote. In terms of JSE listings requirements,the circular to be sent to all shareholders informing them of thegeneral meeting must include, inter alia: |
| |
| | • | | details of the persons to whom the shares are to be issued if suchpersons fall into the following categories or other categoriesidentified by the JSE: directors of the company or its subsidiaries ortheir associates; trustees of employee or directors’ share scheme orpension funds; any person having the right to nominate directors ofthe company; and certain shareholders holding more than 10% of theissued share capital; |
| |
| | • | | if the persons to whom the shares are to be issued are relatedparties, an independent expert’s opinion that the issue price is fairand reasonable; and |
| |
| | • | | should the maximum size of the issue equal or exceed 30% of thecompany’s issued share capital, full listing particulars, whichinclude, inter alia, a reporting accountant’s report and, in the caseof a mining company, a competent person’s report setting out technicaldetails of the company’s operations and assets. |
Transfer of Shares
Owners of our ordinary shares may transfer any or all of their shares in writing in anycommon form or in any form approved by our directors. Every instrument of transfer must be executedby the transferor or, if the directors so determine, by the transferor and the transferee. Thetransferor will remain the holder of the ordinary shares transferred until the name of thetransferee is entered in our register of members in respect of such ordinary shares.
The Board may refuse to recognize any instrument of transfer that is not duly stamped (ifrequired) or is not accompanied by appropriate evidence of the transferor’s title. Such right ofrefusal will not prevent dealings occurring on an open and proper basis. We retain all instrumentsof transfer that are registered. Any instrument of transfer that the Board refuses to register is,except in the case of fraud, returned on demand to the person depositing such instrument.
Rights of Minority Shareholders and Fiduciary Duties
Majority shareholders of South African companies have no fiduciary obligations underSouth African common law to minority shareholders. However, under the Companies Act, a shareholdermay, under certain circumstances, seek relief from the court if he has been unfairly prejudiced bythe company. The provisions in the Companies Act are designed to provide relief for oppressedshareholders without necessarily overruling the majority’s decision. There may also be common lawpersonal actions available to a shareholder of a company.
Although the concepts are similar, the specific interpretations of fiduciary obligationsof directors in South Africa may differ from those in the U.S. and certain other countries. InSouth Africa, the common law imposes on directors a duty to act with care, skill and diligence andfiduciary duties, which include the duty to conduct the company’s affairs honestly and in the bestinterests of the company.
Variation of Rights
We may vary the rights attached to any issued or not yet issued shares by specialresolution. However, if at any time the issued share capital is divided into different classes ofshares, the rights attached to any class may not be varied except with the consent in writing ofthe holders of at least 75% of the issued shares of that class or through a resolution passed at aseparate general meeting of the holders of the shares of that class. The quorum for such a meetingshall be the lesser of (i) 3 shareholders or (ii) 75% of the shareholders of that class, present inperson or by their representatives, agents or proxies, provided that such shareholders must controlor hold at least one half of the issued shares of that class. A share shall be a share of adifferent class from another share if the two shares do not rank pari passu in every respect.
Changes in Capital or Objects and Powers of Harmony
The provisions of our Memorandum and Articles of Association pertaining to changes in ourshare capital and powers are substantially equivalent to the provisions of the Companies Act. Wemay by special resolution:
| | • | | increase our authorized or paid-up share capital; |
| |
| | • | | consolidate and divide all or any part of our shares into shares of a larger amount; |
| |
| | • | | increase the number of our no par value shares without an increase of our stated capital; |
| |
| | • | | sub-divide all or any part of our shares having a par value; |
141
| | • | | convert all of our ordinary or preference share capital consisting of shares having apar value into stated capital constituted by shares of no par value and vice versa; |
| |
| | • | | convert our stated capital constituted by ordinary or preference shares of no par valueinto share capital consisting of shares having a par value; |
| |
| | • | | vary the rights attached to any shares whether issued or not yet issued; |
| |
| | • | | convert any of our issued or unissued shares into shares of another class; |
| |
| | • | | convert any of our paid-up shares into stock, and reconvert any stock into any number ofpaid-up shares of any denomination; |
| |
| | • | | convert any of our issued shares into preference shares which can be redeemed; |
| |
| | • | | cancel shares which, at the date of passing of the resolution, have not been taken oragreed to be taken by any person, and diminish the amount of the authorized sharecapital by the amount of the shares so cancelled; or |
| |
| | • | | reduce the authorized share capital. |
We may by ordinary resolution:
| | • | | reduce our issued share capital; |
| |
| | • | | reduce our stated capital; or |
| |
| | • | | reduce our capital redemption reserve fund and share premium account. |
Meetings of Shareholders
Our directors may at any time convene general meetings of our shareholders. The directorsshall convene a general meeting upon request of shareholders in accordance with the provisions ofthe Companies Act. No more than fifteen months may elapse between the date of one annual generalmeeting and the next, and the annual general meeting shall be held within six months after theexpiration of each of our financial years.
We are required to provide our members with written notice of meetings, which shallspecify the place, the day and time of the meeting. In every notice calling a meeting of Harmony orof any class of members of Harmony, there shall appear with reasonable prominence a statement thata member entitled to attend and vote is entitled to appoint a proxy to attend and vote in lieu ofsuch person and that a proxy need not also be a member. Notice of a general meeting shall be givento the JSE and to the following persons and no other person shall be entitled to receive notice ofgeneral meetings:
| | • | | to every member of Harmony except any member who has not supplied to Harmony a registeredaddress for the giving of notices; |
| |
| | • | | to every person entitled to a share in consequence of the death or insolvency of a member; |
| |
| | • | | to the directors and auditor for the time being of Harmony; and |
| |
| | • | | by advertisement to the holders of share warrants to bearer. |
Annual general meetings and meetings calling for the passage of a special resolutionrequire twenty-one days’ notice in writing. Any other general meeting requires no less thanfourteen days’ notice in writing. A meeting called upon shorter notice shall be deemed to have beenduly called if a majority in number of the members having a right to attend and vote at the meetingagree to such a shortened notice period, and if such members hold no less than 95% of the totalvoting rights of all members.
Our business may be transacted at a general meeting only when a quorum of members ispresent. Three members present personally or by representative and entitled to vote are a quorum.
The annual general meeting deals with and disposes of all matters prescribed by ourArticles of Association and by the Companies Act, including:
| | • | | the consideration of the annual financial statements and report of the auditors; |
| |
| | • | | the election of directors; |
142
| | • | | the appointment of auditors; and |
| |
| | • | | any business arising from the annual financial statements considered at the meeting. |
The holder of a general or special power of attorney given by a member, whether theholder is a member or not, shall be entitled to attend meetings of Harmony or of any class ofmembers of Harmony and to vote at such meetings if so authorized by the power of attorney. Anymember may appoint a proxy, who need not be a member, to attend, speak and, subject to theprovisions of the Companies Act, to vote in his place on a show of hands and on a poll at anygeneral meeting or at any meeting of any class of members. The instrument appointing a proxy tovote at a meeting of Harmony and the power of attorney or other authority shall be deposited at ourtransfer office not later than 48 hours (excluding Saturdays, Sundays and Public Holidays) beforethe meeting at which the person empowered proposes to vote. No instrument appointing a proxy shallbe valid after the end of a period of 6 months commencing on the date on which it is signed unlessotherwise expressly stated in the proxy.
Title to Shares
The registered holder or holders of any shares shall, during his or their respectivelifetimes and while not subject to any legal incapacity, be the only person or persons recognizedby us as having any right to, or in respect of, such shares and, in particular, we shall not bebound to recognize:
| | • | | that the registered holder or holders hold such shares upon trust for,or as the nominee of, any other person; or |
| |
| | • | | that any person, other than the registered holder or holders, holdsany contingent, future or partial interest in such shares or anyinterest in any fractional part of any of such shares. |
Where any share is registered in the names of two or more persons they shall be deemed tobe joint holders. Accordingly where any member dies, the survivor or survivors, where the deceasedwas a joint holder, and the executor of the deceased, where the deceased was the sole holder, shallbe the only persons recognized by us as having any right to the interest of the deceased in any ofour shares.
We may enter in the register as member, no mine official, of Harmony, the name of anyperson who submits proof of his appointment as the executor, administrator, trustee, curator orguardian in respect of the estate of a deceased member of Harmony or of a member whose estate hasbeen sequestrated or of a member who is otherwise under disability or as liquidator of any bodycorporate in the course of being wound up which is a member of Harmony, and any person whose namehas been so entered in the register shall be deemed to be a member of Harmony.
Non-South African Shareholders
There are no limitations imposed by South African law or by our Articles of Associationon the rights of non-South African shareholders to hold or vote our ordinary shares or securitiesconvertible into ordinary shares.
Disclosure of Interest in Shares
Pursuant to the Companies Amendment Act Number 37 of 1999, where securities of an issuerare registered in the name of a person and that person is not the holder of the beneficial interestin all of the securities so held, it is obliged, at the end of every three-month period afterJune 30, 1999 (i.e., commencing on September 30, 1999), to disclose to the issuer the identity ofeach person on whose behalf the registered holder holds securities and the number and class ofsecurities issued by that issuer held on behalf of each such person. Moreover, an issuer ofsecurities may, by notice in writing, require a person who is a registered shareholder, or whom theissuer knows or has reasonable cause to believe to have a beneficial interest in, a security issuedby the issuer, to confirm or deny whether or not such person holds that beneficial interest and, ifthe security is held for another person, to disclose to the issuer the identity of the person onwhose behalf a security is held. The addressee of the notice may also be required to giveparticulars of the extent of the beneficial interest held during the three years preceding the dateof the notice. All issuers of securities are obliged to establish and maintain a register of thedisclosures described above and to publish in their annual financial statements a list of thepersons who hold beneficial interests equal to or in excess of 5% of the total number of securitiesof that class issued by the issuer together with the extent of those beneficial interests.
Changes in Control
There are various procedures under the Companies Act whereby mergers and takeovers can beeffected. These procedures are not exclusive and there are a variety of techniques that can be usedto acquire control. All of these procedures are, however, subject to control by the
143
SecuritiesRegulation Panel and the requirements embodied in the Securities Regulation Code on Takeovers and Mergers shall be adhered to. The JSEListing Requirements also contain certain requirements with regard to the process involved in amerger or takeover. While the requirements of the Securities Regulation Panel and the JSE ListingsRequirements might have the general effect of delaying, deferring or preventing a change in controlof a company, our Memorandum and Articles of Association do not impose additional restrictions onmergers or takeovers.
Register of Members
We keep a register of shareholders at our office and at the office of our transfersecretaries in South Africa, and our transfer secretaries in the United Kingdom keep a branchshareholders’ register at their offices.
The register of members includes:
| | • | | the names and address of the members; |
| |
| | • | | the shares held by each member, distinguishing each share by its denoting number, ifany, by its class or kind, and by the amount paid or deemed to be paid thereon; |
| |
| | • | | the date on which the name of any person was entered in the register as a member; and |
| |
| | • | | the date on which any person ceased to be a member. |
Annual Report and Accounts
The Board is required to keep such accounting records and books of account as areprescribed by the Companies Act.
The directors will cause to be prepared annual financial statements and a South Africanannual report as required by the Companies Act and the JSE rules. We will deliver a copy of theSouth African annual report and annual financial statements to every member not less thantwenty-one days prior to the date of each annual general meeting.
Our annual report on Form 20-F is available on our website at www.harmony.co.za. We willdeliver a paper copy of the annual report containing our IFRS audited financial statements, free ofcharge, to any shareholder upon request.
MATERIAL CONTRACTS
We enter into material contracts in connection with our business, as described in Item 4.“Information on the Company — Business” and in connection with financing arrangements, as describedin Item 5. “Operating and Financial Review and Prospects — Liquidity and Capital Resources”.
EXCHANGE CONTROLS
Introduction
The following is a general outline of South African exchange controls. Investors shouldconsult a professional adviser as to the exchange control implications of their particularinvestments.
The Republic of South Africa’s exchange control regulations provide for restrictions onexporting capital from a Common Monetary Area consisting of South Africa, the Republic of Namibiaand the Kingdoms of Lesotho and Swaziland. Transactions between South African residents (includingcorporations) and between residents of the Common Monetary Area are subject to these exchangecontrols, which are regulated by the South African Reserve Bank (“SARB”).
Since 1995 a number of exchange control regulations have been relaxed with regard to bothresidents and non-residents. The government remains committed to the total abolition of exchangecontrols, but has stated its intention of following a gradual approach. This gradual approach tothe abolition of exchange controls adopted by the South African government is designed to allow theeconomy to adjust more smoothly to the removal of controls that have been in place for aconsiderable period of time. The stated objective of the authorities is to reach a point wherethere is equality of treatment between residents and non-residents in relation to inflows andoutflows of capital. South Africa, being classified as an emerging market, is therefore stillregarded as a capital importer, hence the controls over capital flows. The risk of capital outflowhas been eased over the past five years due to the substantial inflows of foreign portfolioinvestment and a substantial increase in the country’s foreign exchange reserves. Unlimited outwardtransfers of capital are not permitted at this stage, but the emphasis of regulation is expected tobe increasingly on the positive aspects of prudential financial supervision.
144
Further exchange control liberalization will depend to a large extent on the achievement andmaintenance of balance of payments and exchange rate stability.
A considerable degree of flexibility is built into the system of exchange controls, andthe SARB possesses substantial discretionary powers in approving or rejecting the applications thatfall outside the authority granted to authorized dealers.
The main purpose of exchange controls is to ensure the timely repatriation of funds intothe South African banking system of certain foreign currency acquired by residents of South Africa,whether through transactions of a current or of a capital nature. Timely repatriation of funds willhelp avoid undue pressure on the country’s gold and foreign reserves and an undue depreciation ofthe exchange rate of the Rand, which in turn would result in significant domestic inflation and aweakening of the country’s terms of trade with the rest of the world. Payment of foreign currencyand the use of gold and foreign reserves for importation of goods and services into the country arerelatively freely allowed.
These comments relate to exchange controls in force at June 30, 2008. These controls aresubject to change at any time without notice. It is not possible to predict whether existingexchange controls will be abolished, continued or modified by the South African government in thefuture.
Government Regulatory Considerations
Shares
A foreign investor may invest freely in shares in a South African company, whether listedon the JSE or not. The foreign investor may also sell his or her share investment in a SouthAfrican company and transfer the proceeds out of South Africa without restriction. However, whenthe company is not listed on the JSE, the SARB must be satisfied that the sales price of any sharesreflects fair market value.
Under present South African exchange control regulations, our ordinary shares and ADSsare freely transferable outside the Common Monetary Area between non-residents of the CommonMonetary Area. No prior SARB approval is required for the transfer of proceeds to South Africa, inrespect of shares listed on the JSE, provided these funds enter the country through the normalbanking channels. In addition, the proceeds from the sale of ordinary shares on the JSE on behalfof those holders of ordinary shares who are not residents of the Common Monetary Area are freelyremittable to those holders. Share certificates and warrant certificates held by non-residents willbe endorsed with the words “non-resident.”
Loans
Generally, the making of loans to us or our subsidiaries, our or our subsidiaries’ability to borrow from non-South African sources and the repatriation of dividends, interest androyalties by Harmony will be regulated by the Exchange Control Department of the SARB. If a foreigninvestor wishes to lend capital to a South African company, the prior approval of the SARB must besought mainly in respect of the interest rate and terms of repayment applicable to such loan.
Interest on foreign loans is freely remittable abroad, provided the loans received priorapproval from the SARB.
Investments
We are also required to seek approval from the SARB to use funds held in South Africa tomake investments outside of South Africa.
Dividends
Dividends declared by a quoted company are freely transferable out of South Africa fromboth trading and non-trading profits earned in South Africa through a major bank as agent for theSARB.
Where 75% or more of a South African company’s capital, voting power, power of control orearnings is directly or indirectly controlled by non-residents, such a company is designated an“affected person” by the SARB, and certain restrictions are placed on its ability to obtain localfinancial assistance. We are not, and have never been, designated an “affected person” by the SARB.
If an affected person made use of local borrowing facilities, the affected persons mustapply for SARB approval prior to remitting dividends offshore. As a general matter, an affectedperson that has accumulated historical losses may not declare dividends out of current profitsunless and until such time that the affected person’s local borrowings do not exceed the localborrowing limit.
145
CERTAIN SOUTH AFRICAN TAX CONSIDERATIONS
The discussion in this section is based on current law and our interpretation thereof.Changes in the law may alter the tax treatment of our ordinary shares or ADSs, as applicable,possibly on a retroactive basis. The following summary is not a comprehensive description of all ofthe tax considerations that may be relevant to a decision to purchase, own or dispose of ourordinary shares or ADSs, and does not cover the tax consequences that depend upon your particulartax circumstances. In particular, the following summary addresses tax consequences for holders ofordinary shares or ADSs who are not tax residents of South Africa. It specifically excludes thetax consequences for non-tax residents whose holding of shares or ADSs is effectively connectedwith a permanent establishment in South Africa through which the holder carries on businessactivities, or who is not a beneficial recipient of the dividends, or where the source of thetransaction is to be in South Africa. In addition, it does not cover the tax consequences for theholder that is not entitled to the benefits of the double taxation agreement concluded between theRepublic of South Africa and the United States of America signed on February 17, 1997 (“Treaty”).It also assumes that the holders would hold the ordinary shares or ADSs on capital account (thatis, for investment purpose). We recommend that you consult your own tax adviser about theconsequences of holding our ordinary shares or ADSs, as applicable, in your particular situation.
Dividends
South Africa does not currently level any withholding tax on dividends. Rather, it currentlyimposes a corporate tax known as Secondary Tax on Companies (“STC”) at a rate of 10% on dividendsdeclared by a South African company. It is important to appreciate that STC is not a withholdingtax on dividends, but a tax on profits of a company. However, it was announced that STC would beabolished and be replaced by a dividend withholding tax by the end of calendar year 2009. The rateof the new dividend withholding tax will be 10%. The new withholding tax will be imposed on,amongst others, non-resident shareholders, and it would be withheld by the company declaring andpaying the dividend to its shareholders.
Article 10 of the Treaty provides that a withholding tax may be levied by South Africa.However, it may not exceed 5% of the gross amount of the dividends if the beneficial owner is acompany which holds directly at least 10% of the voting stock of the company paying the dividends.Although the Treaty refers to a maximum withholding tax rate of 15% in other cases, the rate wouldbe 10%.
Capital Gains Tax
A Capital gains Tax (“CGT”) was introduced with effect from October 1, 2001. CGT is onlyapplicable to non-residents if the proceeds from the sale are attributable to a permanentestablishment of the non-resident shareholder. The Treaty (which would prevail the case ofconflict) provides that the U.S. holder of ordinary shares or ADSs will not be subject to CGT ifthe assets have been held as capital assets, unless they are linked to a permanent establishment ofsuch non-resident shareholder in South Africa. To the extent that shares or ADSs are hold onrevenue account, a similar principle would apply with reference to the payment of income tax, andincome tax will only be payable to the extent that the holder carries on business in South Africathrough the permanent establishment situation therein. Any gains realized on the disposal ofshares are automatically deemed to be of a capital nature if they have been held for a continuousperiod of 3 years. Such provision applies automatically and is not elective.
Security Transfer Tax
A Security Transfer Tax (“STT”) has been introduced with effect from July 1, 2008 in respect of thetransfer of any security issued by a South African company at a rate of 0.25% of the taxable amountof the security concerned (generally the market value thereof). A security is defined to includedepository receipt in a company, in addition to company shares. STT is not payable on the issue ofany security.
Although ADSs in respect of our shares are not listed on the JSE, reference is specifically made tothe transfer of depository receipts in a South African company. As a consequence, STT willtherefore be payable on the transfer of ADSs. In addition, the process of depositing shares listedon the JSE in return for ADSs, or withdrawing such shares from the deposit facility, may attractSTT as and when the shares are transferred to or from the depository institution.
STT is payable by the broker or participant if a transaction is effected through a stockbroker or astrata participant, but it may be recovered from the person acquiring the beneficial ownership ofthe rights concerned. In other instances, STT is payable by the person acquiring beneficialownership.
STT is also payable on the subsequent redemption or cancellation of shares.
146
CapitalizationShares
Capitalization shares distributed at the option of holders of shares in lieu of cashdividends are currently not subject to STC. However, this position may change to the extent thatthe new withholding tax on dividends is introduced.
Voting Rights
There are no limitations on the right of non-resident or foreign owners to hold or voteour ordinary shares imposed by South African law or by our charter.
CERTAIN UNITED STATES FEDERAL INCOME TAX CONSIDERATIONS
Except as described below under the heading “Non-U.S. Holders,” the following summarydescribes the material U.S. federal income tax consequences for a U.S. holder of owning theordinary shares. For purposes of this summary, references to the ordinary shares include the ADSs,unless the context otherwise requires. You will be a U.S. holder if you are an individual who is acitizen or resident of the United States, a U.S. domestic corporation, or any other person that issubject to U.S. federal income tax on a net income basis in respect of an investment in theordinary shares. This summary does not purport to be a comprehensive description of all of the taxconsiderations that may be relevant to a decision to purchase the ordinary shares. In particular,this summary deals only with U.S. holders that will hold the ordinary shares as capital assets. Itdoes not address considerations that may be relevant to you if you are an investor that is subjectto special tax rules, such as a bank, thrift, real estate investment trust, regulated investmentcompany, insurance company, dealer in securities or currencies, trader in securities or commoditiesthat elects mark-to-market treatment, person that will hold the ordinary shares as a hedge againstcurrency risk or as a position in a “straddle” or conversion transaction, tax-exempt organization,or person whose “functional currency” is not the U.S. dollar.
This summary is based on laws, regulations, rulings, and decisions now in effect, all ofwhich may change. Any change could apply retroactively and could affect the continued validity ofthis summary.
You should consult your own tax advisors about the tax consequences of holding theordinary shares, including the relevance to your particular situation of the considerationsdiscussed below, as well as the relevance to your particular situation of state, local, or othertax laws.
If you are not a U.S. holder, or a non-U.S. holder, the discussion below under “—Non-U.S. Holders” will apply to you.
ADSs
In general, if you hold ADSs, you will be treated as the holder of the ordinary sharesrepresented by those ADSs for U.S. federal income tax purposes.
Taxation of Dividends
The gross amount of dividends that you receive in cash (or that are part of adistribution that any shareholder has the right to receive in cash) in respect of the ordinaryshares generally will be subject to U.S. federal income taxation as foreign source dividend income.
Dividends paid in South African Rand will be includible in your gross income in a U.S.dollar amount calculated by reference to the exchange rate in effect on the day you receive (or thedepository receives, in the case of the ADSs) the dividend. You generally should not be required torecognize any foreign currency gain or loss to the extent such dividends paid in South African Randare converted into U.S. dollars immediately upon receipt by the applicable party.
Capital Gains
If you sell your ordinary shares, you will recognize capital gain or loss in an amountequal to the difference between the amount you realize on the sale and your adjusted tax basis inthe ordinary shares. Such gain or loss generally will be long-term capital gain or loss if you heldthe ordinary shares for more than one year. Long-term capital gain recognized by an individual U.S.holder is generally subject to a maximum tax rate of 15%. In general, any capital gain or lossrecognized upon the sale or exchange of ordinary shares will be treated as U.S. source income orloss, as the case may be, for U.S. foreign tax purposes. Your ability to offset capital lossesagainst income is subject to limitations.
Deposits and withdrawals of ordinary shares by U.S. holders in exchange for ADSs will notresult in the realization of gain or loss for U.S. federal income tax purposes.
To the extent that you incur South African stamp duty, MST or uncertified securities tax(to be replaced with STT) in connection with a
147
transfer or withdrawal of ordinary shares asdescribed under “— Certain South African Tax Considerations — Security Transfer Tax” above, such stamp duty, MST or uncertifiedsecurities tax will not be a creditable tax for U.S. foreign tax credit purposes.
Non-U.S. Holders
If you are a non-U.S. holder of the ordinary shares, you generally will not be subject toU.S. federal income or withholding tax on dividends received on such ordinary shares, unless suchincome is effectively connected with your conduct of a trade or business in the United States. Ifyou are a non-U.S. holder of the ordinary shares, you will also generally not be subject to U.S.federal income or withholding tax in respect of gain realized on the sale of such ordinary shares,unless (i) such gain is effectively connected with your conduct of a trade or business in theUnited States or (ii) in the case of gain realized by an individual non-U.S. holder, you arepresent in the United States for 183 days or more in the taxable year of the sale and certain otherconditions are met. If you are a corporate foreign shareholder, effectively connected income may,under certain circumstances, be subject to an additional branch profits tax.
U.S. Information Reporting and Backup Withholding Rules
Payments of dividends and sales proceeds that are made within the United States orthrough certain U.S.-related financial intermediaries are subject to information reporting and maybe subject to backup withholding at a rate currently of 28% unless the holder (i) is a corporationor other exempt recipient or (ii) provides a taxpayer identification number and certifies that noloss of exemption from backup withholding has occurred. Holders that are not U.S. persons generallyare not subject to information reporting or backup withholding. However, such a holder may berequired to provide a certification of its non-U.S. status in connection with payments receivedwithin the United States or through a U.S.-related financial intermediary.
The preceding discussion of certain United States federal income tax consequences isintended for general information only and does not constitute tax advice. Accordingly, eachinvestor should consult its own tax adviser as to particular tax consequences to it of purchasing,holding and disposing of the ordinary shares and warrants, including the applicability and effectof any state, local or foreign laws, and proposed changes in applicable laws.
DIVIDENDS AND PAYING AGENTS
Not applicable.
STATEMENTS BY EXPERTS
Not applicable.
DOCUMENTS ON DISPLAY
Our Memorandum and Articles of Association may be examined at our principal place ofbusiness at: Randfontein Office Park, Corner of Main Reef Road and Ward Avenue, Randfontein, 1760,South Africa. We also files annual and, furnishes interim reports and other information with theSecurities and Exchange Commission, or the SEC. You may read and copy any reports or otherinformation on file at the SEC’s public reference room at the following location:
Public Reference Room
100 F Street, NW
Room 1580
Washington D.C. 20549
Please call the SEC at 1-800-SEC-0330 for further information on the public referencerooms. The SEC filings are also available to the public from commercial document retrievalservices. We file electronically with the SEC, and the documents it files are available on thewebsite maintained by the SEC at www.sec.gov.
SUBSIDIARY INFORMATION
Not applicable.
148
Item 11. QUANTITATIVE AND QUALITATIVE DISCLOSURES ABOUT MARKET RISK
General
We are exposed to market risks, including credit risk, foreign currency risk, commodityprice risk and interest rate risk associated with underlying assets, liabilities and anticipatedtransactions. Following periodic evaluation of these exposures, we may enter into derivativefinancial instruments to manage these exposures. We have policies in areas such as counterpartyexposure and hedging practices, which have been approved by our senior management. We do not holdor issue derivative financial instruments for trading or speculative purposes.
We did not apply hedge accounting to incidental hedges held in the past.
In accordance with IAS 39 — Financial Instruments: Recognition and Measurement, weaccount for our derivative financial instruments as hedging transactions if the following criteriaare met:
| | • | | in the case of a hedge of an anticipated future transaction, there isa high probability that the transaction will occur. |
Foreign Currency Sensitivity
In the ordinary course of business, we enter into transactions denominated in foreigncurrencies (primarily U.S. dollars, Australian dollars and Kina). In addition, we incur investmentsand liabilities in U.S. dollars, Canadian dollars, British pounds sterling and Australian dollarsfrom time to time. As a result, we re subject to transaction and translation exposure fromfluctuations in foreign currency exchange rates. We do not generally hedge our exposure to foreigncurrency exchange rates.
Ourrevenues and costs are very sensitive to the exchange rate of theRand and other non-U.S. currencies to the U.S. dollar becausegold is generally sold throughout the world in U.S. dollars, but most of our operating costs areincurred in Rand and other non-U.S. currencies. Appreciation of theRand and other non-U.S. currencies against the U.S. dollar increases working costs at ouroperations when those costs are translated into U.S. dollars, which reduces operatingmargins and net income from our operations. Depreciation of the Rand and other non-U.S. currencies against the U.S.dollar reduces these costs when they are translated into U.S. dollars, which increases operatingmargins and net income from our operations. See Item 3. “Key Information — ExchangeRates” and Item 3. “Key Information — Risk Factors — Because most of Harmony’s production costs arein Rand and other non-U.S. currencies, while gold is generally sold in U.S. dollars, Harmony’s financial condition could bematerially harmed by an appreciation in the value of the Rand and other non-U.S. currencies”.
Commodity Price Sensitivity
General
The market price of gold has a significant effect on our results of operations, ourability to pay dividends and undertake capital expenditures, and the market prices of our ordinaryshares.
Gold prices have historically fluctuated widely and are affected by numerous industryfactors over which we do not have any control. See Item 3. “Key Information — Risk Factors — Theprofitability of Harmony’s operations, and the cash flows generated by those operations, areaffected by changes in the market price for gold, which in the past has fluctuated widely”. Theaggregate effect of these factors, all of which are beyond our control, is impossible for us topredict.
Harmony’s Hedging Policy
As a general rule, we sell our gold production at market prices. We generally do notenter into forward sales, commodity, derivatives or hedging arrangements to establish a price inadvance for the sale of our future gold production, although we may do so in the future. For moredetailed information on our hedging policy, see Item 4. “Information on the Company — Business —Hedge Policy”.
A substantial proportion of the production of both New Hampton and Hill 50 was alreadyhedged when acquired by us. In fiscal 2003, we restructured the overall hedge portfolio of theAustralian operations and changed the classification of the hedge book from normal purchase andsale agreements to speculative contracts. The mark-to-market movements on these contracts werereflected in the income statement. We have reduced the remaining hedge positions of the Australianoperations by primarily closing out the remainder of these hedge agreements. In fiscal 2007, weclosed out the remainder of our Australian hedge book, which we had inherited with the acquisitionof the Hill 50 mine. In total, some 220,000 ounces were closed out at an average spot rate ofA$809/ounce, for a total cost of A$72.8 million (U.S.$60.0 million). This means that we arecompletely unhedged.
149
Commodity Sales Agreements
We did not have any forward commodity sales agreements in place during fiscal 2008.
Commodity Hedging Experience
In fiscal 2008, we sold 1,948,776 ounces of gold at an average price of U.S.$818 perounce. At a gold price of U.S.$500, product sales would have amounted to approximately U.S.$974million for fiscal 2008, a reduction of approximately U.S.620 million in product sales. In fiscal2007, we sold 2,334,198 ounces of gold at an average price of U.S.$638 per ounce. At a gold priceof U.S.$500, product sales would have amounted to approximately U.S.$1,167 million for fiscal 2007,a reduction of approximately U.S.322 million in product sales. In fiscal 2006, we sold 2,386,925ounces of gold at an average price of U.S.$529 per ounce. At a gold price of U.S.$250, productsales would have amounted to approximately U.S.$597 million for fiscal 2006, a reduction ofapproximately U.S.$666 million in product sales.
Thegold spot price on October 21, 2008 was U.S.$772/oz per ounce. During fiscal 2008,the gold spot price traded in a range from U.S.$649 to U.S.$1,011 per ounce.
Foreign Currency Sensitivity
Our revenues are sensitive to the exchange rate of the Rand and other non-U.S. currenciesto the U.S. dollar. We generally do not enter into forward sales, commodity, derivatives or otherhedging arrangements to establish a ZAR/U.S.$ exchange rate in advance for the sale of our futuregold production.
We, however, inherited forward exchange contracts with the acquisition of Avgold infiscal 2004. Hedge accounting was not applied and the mark-to-market movement was reflected in theincome statement. The last portion of these forward exchange contracts matured on December 31,2005. All the forward exchange contracts were closed out in accordance with the contractspecifications, resulting in our NIL exposure on June 30, 2008.
We did not have any currency contracts in place as of June 30, 2008 or as of June 30, 2007.
Sensitivity Analysis
All of our currency contracts were closed out as of June 30, 2006.
Interest Rate Sensitivity
Our interest rate risk arises mainly from long-term borrowings. We have both fixed andvariable interest rate borrowings. Fixed rate borrowings expose us to fair value interest raterisk. Variable rate borrowings expose us to cash flow interest rate risk. We have not entered intointerest rate swap agreements in fiscal years 2006, 2007 and 2008.
Sensitivity analysis
A change of 100 basis points in interest rates at June 30, 2008 and 2007 would have increased(decreased) profit or loss before tax by the amounts shown below. This analysis assumes that allother variables remain constant.
| | | | | | | | | |
| | | June 30, |
| | | 2008 | | 2007 |
| | | ($ in millions) |
Increase in 100 basis points | | | 3 | | | | 16 | |
Decrease in 100 basis points | | | (3 | ) | | | (16 | ) |
The above table excludes the fixed rate convertible bond. As it is accounted for at amortizedcost, interest rate changes do not affect reported profit and loss.
For further information on sensitivities, see note 4 of the consolidated financial statements.
150
Item 12. DESCRIPTION OF SECURITIES OTHER THAN EQUITY SECURITIES
Not applicable.
151
GLOSSARY OF MINING TERMS
The following explanations are not intended as technical definitions, but rather are intended toassist the general reader in understanding certain terms as used in this annual report.
Alluvial: the product of sedimentary processes in rivers, resulting in the deposition ofalluvium (soil deposited by a river).
Arenaceous: said of a sediment or sedimentary rock consisting wholly or in part ofsand-sized fragments or having a sandy texture or the texture of such a sediment or rock.
Auriferous: a substance that contains gold (AU).
Beneficiation: the process of adding value to gold products by transforming gold bullioninto fabricated gold products.
Call option: a contract that permits the owner to purchase an asset at a specified priceon or before a specified date.
Carbon In Pulp (CIP): a common process used to extract gold from cyanide leach slurries.The process consists of carbon granules suspended in the slurry and flowing counter-current to theprocess slurry in multiple-staged agitated tanks. The process slurry, which has been leached withcyanide prior to the CIP process, contains solubilized gold. The solubilized gold is absorbed ontothe carbon granules, which are subsequently separated from the slurry by screening.
The gold is then recovered from the carbon by electrowinning onto steel wool cathodes or by asimilar process.
Carbon In Solution (CIS): a process similar to CIP except that the gold, which has beenleached by the cyanide into solution, is separated by the process of filtration (solid/liquidseparation). The solution is then pumped through six stages where the solution comes into contactwith the activated carbon granules.
Cash cost: a measure of the average cost of producing an ounce of gold, calculated bydividing the total cash working costs in a period by the total gold production over the sameperiod. Working costs represent total operating costs less certain administrative expenses,royalties and depreciation. In determining the cash cost of different elements of the operations,production overheads are allocated pro rata.
Conglomerate: a coarse-grained classic sedimentary rock, composed of rounded tosub-angular fragments larger than 2mm in diameter (granules, pebbles, cobbles, boulders) set in afine-grained matrix of sand or silt, and commonly cemented by calcium carbonate, iron oxide, silicaor hardened clay.
Crosscut: a mine working that is driven horizontally and at right angles to an adit,drift or level.
Cut and fill: a method of underground mining in which a stope is excavated and refilledwith material (waste or tailings).
Cut-off grade: the grade at which the total profit from mining the orebodies, under aspecified set of mining parameters, is maximized.
Cyanide leaching: the extraction of a precious metal from an ore by its dissolution in acyanide solution.
Decline: an inclined underground access way.
Deferred Stripping: the removal of overburden through stripping in the current period toaccess ore expected to be exploited in a future period. Costs incurred with deferred stripping aredeferred until the ore is accessed, in order to ensure matching of costs and revenues.
Depletion: the decrease in quantity of ore in a deposit or property resulting fromextraction or production.
Development: activities (including shaft sinking and on-reef and off-reef tunneling)required to prepare for mining activities and maintain a planned production level and those coststo enable the conversion of mineralized material to reserves.
Electro-winning: the process of removing gold from solution by the action of electriccurrents.
Elution: removal of the gold from the activated carbon before the zinc precipitationstage.
Exploration: activities associated with ascertaining the existence, location, extent orquality of mineralized material, including economic and technical evaluations of mineralizedmaterial.
Fabricated gold: gold on which work has been performed to turn it into a product, such asjewelry, which differs from a pure investment product, such as a gold bullion bar.
152
fatal injury frequency rate: the number of fatal injuries per million hours worked.
Fluvial: produced by the action of a stream or river.
Footwall: the underlying side of a fault, orebody or stope.
Forward purchase: an agreement for the purchase of a commodity at a specified future dateat a fixed price.
Forward sale: the sale of a commodity for delivery at a specified future date and price.
Gold reserves: the gold contained within proven and probable reserves on the basis ofrecoverable material (reported as mill delivered tons and head grade).
Gold lease rate swap: an agreement to pay a floating lease rate in exchange for the fixedlease rate inherent in establishing the fixed price in one or more forward gold sales.
Grade: the quantity of metal per unit mass of ore expressed as a percentage or, for gold,as ounces of gold per ton of ore.
Greenfield: a potential mining site of unknown quality.
Greenstone: a field term applied to any compact dark-green altered or metamorphosed basicigneous rock that owes its color to the presence of chlorite, actinolite or epidote.
Grinding: reducing mineralized rock to the consistency of fine sand by crushing andabrading in a rotating steel grinding mill.
Head grade: the grade of the ore as delivered to the metallurgical plant.
Heap leaching: a low-cost technique for extracting metals from ore by percolatingleaching solutions through heaps of ore placed on impervious pads. Generally used on low-gradeores.
Leaching: dissolution of gold from the crushed and milled material, including reclaimedslime, for absorption and concentration on to the activated carbon.
Level: the workings or tunnels of an underground mine that are on the same horizontalplane.
Littoral: of or pertaining to a shore.
Longhole sub-level caving: a process for removing ore in which relatively thin blocks ofore are caused to cave in by successively undermining small panels of ore. The broken and caved oreis then extracted by mechanical means.
lost time injury frequency rate: the number of lost time injuries per million hours.
Mark-to-market: the current fair value of a derivative based on current market prices orto calculate the current fair value of a derivative based on current market prices, as the case maybe.
Measures: conversion factors from metric units to U.S. units are provided below.
| | | | | |
| Metric unit | | | | U.S. equivalent |
1 tonne | | = 1 t | | = 1.10231 short tons |
1 gram | | = 1 g | | = 0.03215 ounces |
1 gram per tonne | | = 1 g/t | | = 0.02917 ounces per short ton |
1 kilogram per tonne | | = 1 kg/t | | = 29.16642 ounces per short ton |
1 kilometer | | = 1 km | | = 0.621371 miles |
1 meter | | = 1 m | | = 3.28084 feet |
1 centimeter | | = 1 cm | | = 0.3937 inches |
1 millimeter | | = 1 mm | | = 0.03937 inches |
1 hectare | | = 1 ha | | = 2.47105 acres |
Metallurgical plant: a processing plant used to treat ore and extract the contained gold.
Mill delivered tons: a quantity, expressed in tons, of ore delivered to the metallurgicalplant.
153
Milling/mill: the comminution of the ore, although the term has come to cover the broadrange of machinery inside the treatment plant where the gold is separated from the ore.
Mineable: that portion of a mineralized deposit for which extraction is technically andeconomically feasible.
Mineralization: the presence of a target mineral in a mass of host rock.
Mineralized material: a mineralized body that has been delineated by appropriately spaceddrilling and/or underground sampling to support a sufficient tonnage and average grade of metals towarrant further exploration. Such a deposit does not qualify as a reserve until a comprehensiveevaluation based upon unit cost, grade, recoveries, and other material factors conclude legal andeconomic feasibility.
Morphology: the form or shape of a crystal or mineral aggregate.
Open-pit/Open cast/Open cut: mining in which the ore is extracted from a pit. Thegeometry of the pit may vary with the characteristics of the orebody.
Ore: a mixture of mineralized material from which at least one of the contained mineralscan be mined and processed at an economic profit.
Ore grade: the average amount of gold contained in a ton of gold bearing ore expressed inounces per ton.
Ore reserves: that part of mineralized material which at the time of the reservedetermination could be economically and legally extracted or produced. Ore reserves are reported asgeneral indicators of the life of mineralized materials. Changes in reserves generally reflect:
| | • | | development of additional reserves; |
| |
| | • | | depletion of existing reserves through production; |
| |
| | • | | actual mining experience; and |
| |
| | • | | price forecasts. |
Grades of ore actually processed may be different from stated reserve grades because ofgeologic variation in different areas mined, mining dilution, losses in processing and otherfactors. Recovery rates vary with the metallurgical characteristics and grade of ore processed.Neither reserves nor projections of future operations should be interpreted as assurances of theeconomic life of mineralized material nor of the profitability of future operations.
Orebody: a well defined mass of mineralized material of sufficient mineral content tomake extraction economically viable.
Ounce: one Troy ounce, which equals 31.1035 grams.
Overburden: the soil and rock that must be removed in order to expose an ore deposit.
Overburden tons: tons that need to be removed to access an ore deposit.
Palaeotopography: the topography implied at some time in the past.
Pay limit: the breakeven grade at which the orebody can be mined without profit or loss,calculated using the forecast gold price, working costs and recovery factors.
Placer: a sedimentary deposit containing economic quantities of valuable minerals mainlyformed in alluvial environments.
Precipitate: the solid product of chemical reaction by fluids such as the zincprecipitation referred to below.
Probable reserves: reserves for which quantity and grade and/or quality are computed frominformation similar to that used for proven reserves, but the sites for inspection, sampling, andmeasurement are farther apart or are otherwise less adequately spaced. The degree of assurance,although lower than that for proven reserves, is high enough to assume continuity between points ofobservation.
Prospect: an area of land with insufficient data available on the mineralization todetermine if it is economically recoverable, but warranting further investigation.
Prospecting license: an area for which permission to explore has been granted.
Proven reserves: reserves for which: (a) quantity is computed from dimensions revealed inoutcrops, trenches, workings or drill holes; grade and/or quality are computed from the results ofdetailed sampling; and
154
(b) the sites for inspection, sampling and measurement are spaced so closely and the geologiccharacter is so well defined that size, shape, depth and mineral content of reserves arewell-established.
Put option: a contract that enables the owner to sell an asset at a specified price on orbefore a specified date.
Pyrite: a brassy-colored mineral of iron sulphide (compound of iron and sulfur).
Quartz: a mineral compound of silicon and oxygen.
Recovery grade: the actual grade of ore realized after the mining and treatment process.
Reef: a gold-bearing sedimentary horizon, normally a conglomerate band, that may containeconomic levels of gold.
Refining: the final stage of metal production in which final impurities are removed fromthe molten metal by introducing air and fluxes. The impurities are removed as gases or slag.
Rehabilitation: the process of restoring mined land to a condition approximating itsoriginal state.
Sampling: taking small pieces of rock at intervals along exposed mineralization for assay(to determine the mineral content).
Shaft: a shaft provides principal access to the underground workings for transportingpersonnel, equipment, supplies, ore and waste. A shaft is also used for ventilation and as anauxiliary exit. It is equipped with a surface hoist system that lowers and raises conveyances formen, materials and ore in the shaft. A shaft generally has more than one conveyancing compartment.
Slimes: the finer fraction of tailings discharged from a processing plant after thevaluable minerals have been recovered.
Slurry: a fluid comprising fine solids suspended in a solution (generally watercontaining additives).
Smelting: thermal processing whereby molten metal is liberated from beneficiated ore orconcentrate with impurities separating as lighter slag.
Spot price: the current price of a metal for immediate delivery.
Stockpile: a store of unprocessed ore.
Stockwork: mineralized material consisting of a three-dimensional network of planar toirregular veinlets closely enough spaced that the whole mass can be mined.
Stope: the underground excavation within the orebody where the main gold production takesplace.
Stripping: the process of removing overburden to expose ore.
Sulphide: a mineral characterized by the linkages of sulfur with a metal or semi-metal,such as pyrite, FeS.
Syncline: a basin-shaped fold.
Tailings: finely ground rock from which valuable minerals have been extracted by milling.
Ton: one ton is equal to 2,000 pounds (also known as a “short” ton).
Tonnage: quantities where the ton or tonne is an appropriate unit of measure. Typicallyused to measure reserves of gold-bearing material in situ or quantities of ore and waste materialmined, transported or milled.
Tonne: one tonne is equal to 1,000 kilograms (also known as a “metric” ton).
Trend: the arrangement of a group of ore deposits or a geological feature or zone ofsimilar grade occurring in a linear pattern.
Unconformity: the structural relationship between two groups of rock that are not innormal succession.
Waste: ore rock mined with an insufficient gold content to justify processing.
Waste rock: the non-mineralized rock and/or rock that generally cannot be minedeconomically that is hoisted to the surface for disposal on the surface normally close to the shafton an allocated dump.
Yield: the actual grade of ore realized after the mining and treatment process.
Zinc precipitation: a chemical reaction using zinc dust that converts gold solution to asolid form for smelting into unrefined gold bars.
155
PART II
Item 13. DEFAULTS, DIVIDEND ARREARAGES AND DELINQUENCIES
Not applicable.
156
Item 14. MATERIAL MODIFICATIONS TO THE RIGHTS OF SECURITY HOLDERS AND USE OF PROCEEDS
MATERIAL MODIFICATIONS TO THE RIGHTS OF SECURITY HOLDERS
At a general meeting held on November 26, 2007, our shareholders authorized the Board to (i)place 10% of the unissued ordinary shares of the company under directors’ control and (ii)authorizing the Board to allot and issue up to 10% of all or any of our authorized but unissuedordinary shares for cash to such persons and on such terms as the Board may, without restriction,from time to time, deem fit as and when suitable opportunities arise, but subject to therequirements of the JSE .
At a general meeting held on November 11, 2006, our shareholders authorized the Board toacquire from time to time such a number of our issued ordinary shares at such price or prices andon such terms and conditions as the Board may determine, but subject to the requirements of the JSEand the requirements of the other exchanges upon which our ordinary shares may be quoted or listed.The shareholders also approved amendments to our Articles of Association in order to comply withthe JSE amended listing requirements.
At a general meeting held on November 11, 2005, our shareholders authorized the Board toacquire from time to time such a number of our issued ordinary shares at such price or prices andon such terms and conditions as the Board may determine, but subject to the requirements of the JSEand the requirements of the other exchanges upon which our ordinary shares may be quoted or listed.The shareholders also approved amendments to our Articles of Association in order to comply withthe JSE amended listing requirements.
USE OF PROCEEDS
Not applicable.
157
Item 15. DISCLOSURE CONTROLS AND PROCEDURES
(a) Disclosure Controls and Procedures
As of June 30, 2008, our management, with the participation of our Chief Executive Officer(“CEO”) and Chief Financial Officer (“CFO”), carried out an evaluation, pursuant to Rule 13a-15promulgated under the Exchange Act of the effectiveness of our “disclosure controls andprocedures”. Based on the foregoing, our management, including the CEO and CFO, concluded that ourdisclosure controls and procedures were effective as of June 30, 2008.
Our disclosure controls and procedures are designed to provide reasonable assurance thatinformation required to be disclosed by us in the reports that we file or submit under the ExchangeAct is recorded, processed, summarized and reported, within the time periods specified in theapplicable rules and forms and that such information required to be disclosed by us in the reportswe file or submit under the Exchange Act is accumulated and communicated to our management,including our CEO and CFO, as appropriate to allow timely decisions regarding required disclosures.
There are inherent limitations in the effectiveness of any system of disclosure controls andprocedures. These limitations include the possibility of human error and the circumvention oroverriding of the controls and procedures. Accordingly, any such system can only provide reasonableassurance of achieving the desired control objectives.
(b) Management’s Annual Report on Internal Control over Financial Reporting
Our management is responsible for establishing and maintaining effective internal control overfinancial reporting and for the assessment of the effectiveness of internal control over financialreporting. Our internal control over financial reporting is a process designed to providereasonable assurance regarding the reliability of financial reporting and the preparation offinancial statements for external purposes in accordance with generally accepted accountingprinciples. Harmony’s internal control over financial reporting includes those policies andprocedures that (i) pertain to the maintenance of records that, in reasonable detail, accuratelyand fairly reflect the transactions and dispositions of the assets of the Company; (ii) providereasonable assurance that transactions are recorded as necessary to permit preparation of financialstatements in accordance with generally accepted accounting principles, and that receipts andexpenditures of the Company are being made only in accordance with authorizations of management anddirectors of the Company; and (iii) provide reasonable assurance regarding prevention or timelydetection of unauthorized acquisition, use, or disposition of the Company’s assets that could havea material effect on the financial statements. Where appropriate, the necessary actions are takento remedy any failings or weaknesses identified from review of the effectiveness of the internalcontrol system.
Internal control over financial reporting is a process that involves human diligence andcompliance and is subject to lapses in judgment and breakdowns resulting from human error. Internalcontrol over financial reporting also can be circumvented by collusion or improper managementoverride. Because of such limitations, there is a risk that material misstatements may not beprevented or detected on a timely basis by internal control over financial reporting. However,these inherent limitations are known features of the financial reporting process. Therefore, it ispossible to design into the process safeguards to reduce, though not eliminate, this risk.
Management conducted an evaluation of the effectiveness of its internal control over financialreporting based on the framework in Internal Control — Integrated Framework issued by the Committeeof Sponsoring Organizations of the Treadway Commission (“COSO”). Management has assessed theeffectiveness of internal control over financial reporting, as of June 30, 2008, and has concludedthat such internal control over financial reporting was effective based upon those criteria.
PricewaterhouseCoopers Inc, an independent registered public accounting firm, which hasaudited the consolidated financial statements of the Company as of and for the year ended June 30,2008, also assessed the effectiveness of our internal control over financial reporting as ofJune 30, 2008.
(c) Attestation Report of the Registered Public Accounting Firm
See report of PricewaterhouseCoopers Inc, an independent registered public accounting firm,on page F-2.
158
(d) Changes in Internal Control over Financial Reporting
(1) Changes that have materially affected, or are reasonably likely to materially affect, ourinternal control over financial reporting during the period covered by the annual report, needs tobe identified and reported as required by paragraph (d) of Rule 13a-15.
A material weakness is a deficiency, or combination of deficiencies, in internal control overfinancial reporting, such that there is a reasonable possibility that a material misstatement ofthe annual or interim financial statements will not be prevented or detected on a timely basis.
We have previously disclosed in our Annual Report on Form 20-F for the year ended June 30, 2007,material weaknesses in the following areas:
| | • | | failure to maintain an effective information technology control environment; |
| |
| | • | | failure to maintain effective preventative and detective monitoringcontrols over the accuracy of depreciation expense on mining assets underconstruction; |
| |
| | • | | failure to maintain effective preventative and detective monitoringcontrols over the completeness of capitalised borrowing costs on qualifyingassets; |
| |
| | • | | failure to maintain effective preventative and detective monitoringcontrols over the completeness and accuracy of the reconciliation of storesinventory; and |
| |
| | • | | failure to maintain effective preventative and detective monitoringcontrols over the reconciliation of certain adjustments to deferred tax. |
(2) In light of the material weaknesses listed in (1) above, management implemented actions toremediate such ineffectiveness and to strengthen our internal controls over financial reportingthrough the implementation of remedial measures, which include:
| | • | | the appointment of senior financial personnel to expand the capacityof the financial departments and strengthen the overall governancestructure of the company; |
| |
| | • | | the reimplementation of Enterprise Resource Planning (“ERP”) system.In connection the reimplementation, we: |
| | • | | appointed a System Implementation Partner to assist with thereimplementation of the ERP system; |
| |
| | • | | implemented rigorous project and resource planning, testingstrategies, user training, communication management and changemanagement during the life cycle of the ERP system reimplementation; |
| |
| | • | | implemented a detail governance structure and process duringthe life cycle of the ERP system implementation, which included theInternal Audit activities. We also established an ERP ManagementCommittee and Project Steering Committee to monitor the ERPreimplementation; |
| |
| | • | | designed and implemented change and access control proceduresthat apply to all systems, including any configuration changes to ERP.This includes a Change Advisory Panel which is responsible to oversee,monitor and approve all changes made to the system; |
| | • | | implemented manual controls during the ERP reimplementation process toensure reliable and accurate financial information was produced; |
| |
| | • | | the implementation and strengthening of manual quarterly preventativeand detective monitoring controls to mitigate the risk of materialmisstatement in the financial records; |
| |
| | • | | the implementation of preventative and detective monitoring controlsover the accuracy of depreciation expense on mining assets, and thecompleteness of borrowing costs capitalized, including managementreviews on a quarterly basis; |
| |
| | • | | the controls over stores inventory were improved, including regularcycle counts and manual reconciliations; and |
159
| | • | | the implementation of a manual control whereby the deferred taxbalance is reconciled on a quarterly basis to ensure the accuracy andcompleteness of deferred tax and the validity of prior year entriesstill included in the deferred tax balance. |
(3) We concluded that the new and remediated controls related to the material weaknesses previouslydisclosed in the 2007 Annual Report on Form 20-F noted in (1) were designed, in place and operatingeffectively for a sufficient period of time for management to determine that each of the materialweaknesses was remediated as of June 30, 2008.
160
Item 16A. AUDIT COMMITTEE FINANCIAL EXPERT
At this time, we do not have an individual “audit committee financial expert” as definedby the rules of the SEC.
The audit committee members through their collective experience do meet a majority of thedefinitions of the SEC for an “audit committee financial expert” in both the private and publicsectors. The members have served as directors and officers of numerous public companies and haveover the years developed a strong knowledge and understanding of IFRS as issued by the IASB,overseeing the preparation, audit and evaluation of financial statements. We believe that thecombined knowledge, skills and experience of the Audit Committee, and their authority to engageoutside experts as they deem appropriate to provide them with advice on matters related to theirresponsibilities, enable them, as a group, to act effectively in the fulfillment of their tasks andresponsibilities required under the Sarbanes-Oxley Act of 2002. See Item 7. “Directors andManagement — Board Practices — Audit Committee”.
Item 16B. CODE OF ETHICS
The Harmony Code of Ethics has been developed to respond to the challenge of ethical conductin a business environment. The Code of Ethics goes beyond the company’s legal and institutionalresponsibilities by formalizing our values. The purpose of the code is to guide employees’behavior, not to provide specific answers to every conceivable situation in the workplace. Weapproached the development and the annual review of the Code of Ethics in a fully inclusive manner,with broad consultation and information gathering at all levels of the company. Employees have beenkept fully informed about the Code of Ethics and all employees are expected to comply with itscontents. (The term ‘employees’ is used in the broadest sense and includes all staff with which aservice contract exists, including management, non-management, directors, contractors, consultants,suppliers and temporary staff.) An Ethics Committee was formed in May 2006, which consists of fourexecutive managers. This committee is required to meet quarterly to monitor the gift registers andany reported unethical behavior. The Code of Ethics is available on our website atwww.harmony.co.za.
161
Item 16C. PRINCIPAL ACCOUNTANT FEES AND SERVICES
AUDIT FEES
The following sets forth the aggregate fees billed for each of the two past fiscal yearsfor professional fees to our principal accountants for the audit of the annual financial statementsor for services normally provided by the accountant in connection with statutory and regulatoryfilings or engagements for those fiscal years.
| | | | | |
Fiscal year ended June 30, 2007 | | U.S.$1.343 million |
Fiscal year ended June 30, 2008 | | U.S.$1.949 million |
AUDIT-RELATED FEES
The following sets forth additional aggregate fees to those reported under “Audit Fees”in each of the last two fiscal years that were provided by the principal accountant that arereasonably related to the performance of the audit or review of the financial statements:
| | | | | |
Fiscal year ended June 30, 2007 | | U.S.$0.451 million |
Fiscal year ended June 30, 2008 | | U.S.$0.316 million |
Fees related to interim reviews and review of interim reports, other SEC filings as wellas guidance on section 404 Sarbanes Oxley compliance.
TAX FEES
The following sets forth the aggregate fees billed in each of the last two fiscal yearsfor professional services rendered by the principal accountant for tax compliance, tax advice andtax planning:
| | | | | |
Fiscal year ended June 30, 2007 | | U.S.$0.168 million |
Fiscal year ended June 30, 2008 | | U.S.$0.052 million |
Services comprised advice on capital gains tax issues, treatment of tax in respect ofacquisitions, guidance on share option schemes.
ALL OTHER FEES
The following sets forth the aggregate fees billed in each of the last two fiscal yearsfor products and services provided by the principal accountant not described above:
| | | | | |
Fiscal year ended June 30, 2007 | | | — | |
Fiscal year ended June 30, 2008 | | | — | |
AUDIT COMMITTEE APPROVAL
Our audit committee pre-approves our engagement of PricewaterhouseCoopers Inc to renderaudit or non-audit services. All of the services described above were approved by the auditcommittee.
162
Item 16D. EXEMPTIONS FROM LISTING STANDARDS FOR AUDIT COMMITTEES
Not applicable.
163
Item 16E. PURCHASES OF EQUITY SECURITIES BY THE ISSUER AND AFFILIATED PURCHASERS
Not applicable.
164
PART III
Item 17. FINANCIAL STATEMENTS
We have elected to provide financial statements for the fiscal year ended June 30, 2008and the related information pursuant to Item 18.
165
Item 18. FINANCIAL STATEMENTS
Financial Statements
The financial statements appear in this annual report on Form 20-F beginning on page F-3. Thereport of the independent registered public accounting firm appears on page F-2.
166
Item 19. EXHIBITS
| 1.1 | | Memorandum of Association of Harmony, as amended (incorporated by reference toHarmony’s Registration Statement (file no. 333-13516) on Form F-3 filed onJune 21, 2001). |
| |
| 1.2 | | Articles of Association of Harmony, as amended (incorporated by reference toHarmony’s Annual Report on Form 20-F for the fiscal year ended June 30, 2005,filed on November 3, 2005). |
| |
| 2.1 | | Notice to shareholders dated September 25, 2007 in respect of the Annual GeneralMeeting held on November 26, 2007 (incorporated by reference to Harmony’s AnnualReport on Form 20-F for the fiscal year ended June 30, 2007, filed on December 7,2007). |
| |
| 2.2 | | Share Exchange Agreement between Avmin and Harmony to acquire the shareholding inAvgold dated February 16, 2004 (incorporated by reference to Harmony’s AnnualReport on Form 20-F for the fiscal year ended June 30, 2004, as amended, filed onOctober 14, 2004). |
| |
| 2.3 | | Deposit Agreement among Harmony, The Bank of New York, as Depositary, and ownersand holders of American Depositary Receipts, dated as of August 12, 1996, asamended and restated as of October 2, 1996, as further amended and restated as ofSeptember 15, 1998 (incorporated by reference to Post-Effective Amendment No. 1to Harmony’s Registration Statement (file no. 333-5410) on Form F-6 filed onMay 17, 2001). |
| |
| 2.4 | | Form of ADR (included in Exhibit 2.3). |
| |
| 2.5 | | Form of Harmony’s senior unsecured 13% bonds due June 14, 2006 (incorporated byreference to Harmony’s Annual Report on Form 20-F for the fiscal year endedJune 30, 2001 filed on September 26, 2001). |
| |
| 2.6 | | Form of Global Bond (incorporated by reference to Harmony’s Annual Report onForm 20-F for the fiscal year ended June 30, 2004, as amended, filed onOctober 14, 2004). |
| |
| 2.7 | | Bond Offering Circular dated October 14, 2004 (incorporated by reference toHarmony’s Annual Report on Form 20-F for the fiscal year ended June 30, 2004, asamended, filed on October 14, 2004). |
| |
| 4.1 | | Harmony (2003) Share Option Scheme, as amended (incorporated by reference toHarmony’s Annual Report on Form 20-F for the fiscal year ended June 30, 2005,filed on November 3, 2005). |
| |
| 4.2 | | Harmony 2006 Share Scheme (incorporated by reference to Harmony’s Annual Reporton Form 20-F for the fiscal year ended June 30, 2007, filed on December 7, 2007). |
| |
| 4.3 | | Sale of Shares Agreement amongst Harmony, ARMgold Harmony Joint InvestmentCompany (Proprietary) Limited, and The ARM Broad-Based Empowerment Trust signedon April 15, 2005 (incorporated by reference to Harmony’s Annual Report onForm 20-F for the fiscal year ended June 30, 2005, filed on November 3, 2005). |
| |
| 4.4 | | Subordination Agreement amongst Harmony, Nedbank Limited and The ARM Broad-BasedEmpowerment Trust signed on April 15, 2005 (incorporated by reference toHarmony’s Annual Report on Form 20-F for the fiscal year ended June 30, 2005,filed on November 3, 2005). |
| |
| 4.5 | | First Loan Agreement between Nedbank Limited and The ARM Broad-Based EmpowermentTrust signed on April 15, 2005 (incorporated by reference to Harmony’s AnnualReport on Form 20-F for the fiscal year ended June 30, 2005, filed on November 3,2005). |
| |
| 4.6 | | First Ranking Cessation and Pledge between The ARM Broad-Based Empowerment Trustand Nedbank Limited signed on April 15, 2005 (incorporated by reference toHarmony’s Annual Report on Form 20-F for the fiscal year ended June 30, 2005,filed on November 3, 2005). |
| |
| 4.7 | | Second Loan Agreement between Nedbank Limited and The ARM Broad-Based EmpowermentTrust signed on April 15, 2005 (incorporated by reference to Harmony’s AnnualReport on Form 20-F for the |
167
| | | fiscal year ended June 30, 2005, filed on November 3,2005). |
| 4.8 | | Second Ranking Cessation and Pledge between The ARM Broad-Based Empowerment Trustand Nedbank Limited signed on April 15, 2005 (incorporated by reference toHarmony’s Annual Report on Form 20-F for the fiscal year ended June 30, 2005,filed on November 3, 2005). |
| |
| 4.9 | | Flow of Funds Agreement amongst Nedbank Limited, ARMgold Harmony Joint InvestmentCompany (Proprietary) Limited, Harmony and The ARM Broad-Based Empowerment Trustsigned on April 15, 2005 (incorporated by reference to Harmony’s Annual Report onForm 20-F for the fiscal year ended June 30, 2005, filed on November 3, 2005). |
| |
| 4.10 | | Right of Pre-emption and Deed of Adherence between Nedbank Limited, Harmony,African Rainbow Minerals & Exploration Investments (Proprietary) Limited andARMgold Harmony Joint Investment Company (Proprietary) Limited signed onApril 15, 2005 (incorporated by reference to Harmony’s Annual Report on Form 20-Ffor the fiscal year ended June 30, 2005, filed on November 3, 2005). |
| |
| 4.11 | | Agreement of Assignment between African Rainbow Minerals & ExplorationInvestments (Proprietary) Limited, Harmony, ARMgold Harmony Joint InvestmentCompany (Proprietary) Limited and The Trustees of The ARM Broad-Based EmpowermentTrust signed on April 15, 2005 (incorporated by reference to Harmony’s AnnualReport on Form 20-F for the fiscal year ended June 30, 2005, filed on November 3,2005). |
| |
| 4.12 | | Harmony Option Agreement between Harmony and Nedbank Limited signed on April 15,2005 (incorporated by reference to Harmony’s Annual Report on Form 20-F for thefiscal year ended June 30, 2005, filed on November 3, 2005). |
| |
| 4.13 | | Harmony Undertaking amongst Harmony, ARMgold Harmony Joint Investment Company(Proprietary) Limited and Nedbank Limited signed on April 15, 2005 (incorporatedby reference to Harmony’s Annual Report on Form 20-F for the fiscal year endedJune 30, 2005, filed on November 3, 2005). |
| |
| 4.14 | | Term Loan Agreement with Rand Merchant Bank dated March 9, 2006 (incorporated byreference to Harmony’s Annual Report on Form 20-F for the fiscal year endedJune 30, 2006, filed on October 31, 2006). |
| |
| 4.15 | | Pledge Agreement in favor of FirstRand Bank Limited (acting through its RandMerchant Bank division) dated March 9, 2006 (incorporated by reference toHarmony’s Annual Report on Form 20-F for the fiscal year ended June 30, 2006,filed on October 31, 2006). |
| |
| 4.16 | | Senior Facility Agreement among Nedbank Limited and Harmony Gold Mining CompanyLimited and the Guarantors named therein dated on or about September 28, 2007(incorporated by reference to Harmony’s Annual Report on Form 20-F for the fiscalyear ended June 30, 2007, filed on December 7, 2007). |
| |
| 4.17 | | Cessation and Pledge in Security by African Rainbow Minerals Gold Limited infavour of Nedbank dated on or about September 28, 2007 (incorporated by referenceto Harmony’s Annual Report on Form 20-F for the fiscal year ended June 30, 2007,filed on December 7, 2007). |
| |
| 4.18 | | Cessation and Pledge in Security by Harmony Gold Mining Company Limited in favourof Nedbank dated on or about September 28, 2007 (incorporated by reference toHarmony’s Annual Report on Form 20-F for the fiscal year ended June 30, 2007,filed on December 7, 2007). |
| |
| 4.19 | | Preference Share Subscription Agreement dated March 20, 2007 by and amongFirstRand Bank Limited (RMB), Harmony and the subsidiaries named therein(incorporated by reference to Harmony’s Annual Report on Form 20-F for the fiscalyear ended June 30, 2007, filed on December 7, 2007). |
| |
| 4.20 | | Senior Bridge Loan Facility with RMB dated June 29, 2007 (incorporated byreference to Harmony’s Annual Report on Form 20-F for the fiscal year endedJune 30, 2007, filed on December 7, 2007). |
| |
| 4.21 | | Draw Down Facility Agreement with Westpac Bank dated June 27, 2007 (incorporatedby reference to Harmony’s Annual Report on Form 20-F for the fiscal year endedJune 30, 2007, filed on December 7, 2007). |
168
| *4.22 | | Sale Agreement with Randfontein Estates Limited, Clidet No.726 (Proprietary) Limited and Clidet No. 770 (Proprietary) Limited dated December 18, 2007. |
| |
| *4.23 | | Shareholders Agreement between ARMGold/Harmony JointInvestment Company (Proprietary) Limited, Clidet No. 770 (Proprietary) Limited and Clidet No. 726 (Proprietary) Limited dated December 18, 2007. |
| |
| *4.24 | | Sale of Shares and Claim Agreement with Randfontein Estates Limited, ARMGold/Harmony Joint Investment Company (Proprietary) Limited and Clidet No. 770 (Proprietary) Limited dated December 18, 2007. |
| |
| *4.25 | | Deed of Extinguishment of Royalty (Hidden Valley Project) dated May June 11, 2008. |
| |
| *4.26 | | Senior Facility Agreement with Nedbank Limited datedSeptember 28, 2007. |
| |
| *4.27 | | Master Lease Facility Agreement between Morobe ConsolidatedGoldfields Limited and Westpac Bank PNG Limited (Hidden ValleyProject) dated June 14, 2007. |
| |
| 8.1 | | Significant subsidiaries of Harmony Gold Mining Company Limited (incorporated byreference to Harmony’s Annual Report on Form 20-F for the fiscal year endedJune 30, 2005, filed on November 3, 2005). |
| |
| *12.1 | | Certification of the principal executive officer required by Rule 13a-14(a) orRule 15(d)-14(a), pursuant to Section 302 of the Sarbanes Oxley Act of 2002. |
| |
| *12.2 | | Certification of the principal financial officer required by Rule 13a-14(a) orRule 15(d)-14(a), pursuant to Section 302 of the Sarbanes Oxley Act of 2002. |
| |
| *13.1 | | Certification of the principal executive officer, pursuant to Section 906 of theSarbanes Oxley Act of 2002. |
| |
| *13.2 | | Certification of the principal financial officer, pursuant to Section 906 of theSarbanes Oxley Act of 2002. |
169
SIGNATURE
Pursuant to the requirements of Section 12 of the Exchange Act, we hereby certify that wemeets all of the requirements for filing on Form 20-F and that we have duly caused this annualreport to be signed on our behalf by the undersigned, thereunto duly authorized.
HARMONY GOLD MINING COMPANY LIMITED
| | | | | |
By: | | /s/ Graham Briggs | | |
| | | | |
| Graham Briggs | | |
| Chief Executive Officer | | |
| Date: October 29, 2008 | | |
170
Index to Financial Statements
| | | | | |
| | | Page |
Harmony Gold Mining Company Limited | | | | |
| |
| | | F-2 | |
| |
Consolidated Income Statements for the years ended June 30,2008, 2007 and 2006 | | | F-3 | |
| |
ConsolidatedStatements of Other Comprehensive Income for the years ended June 30,2008, 2007 and 2006 | | | F-4 | |
| |
Consolidated Balance Sheets at June 30, 2008 and 2007 | | | F-5 | |
| |
Consolidated Statements of Changes in Shareholders’ Equity forthe years ended June 30, 2008, 2007 and 2006 | | | F-6 | |
| |
Consolidated Statements of Cash Flows for the years endedJune 30, 2008, 2007 and 2006 | | | F-7 | |
| |
Notes to the Consolidated Financial Statements | | | F-8 | |
F-1
Report of Independent Registered Public Accounting Firm
To the Board of Directors and Shareholders of Harmony Gold Mining Company Limited
In our opinion, the accompanying consolidated balance sheets and the related consolidatedincome statements, statements of other comprehensive income, of changes in shareholders’ equity andcash flows present fairly, in all material respects, the financial position of Harmony Gold MiningCompany Limited and its subsidiaries at June 30, 2008 and 2007, and the results of their operationsand their cash flows for each of the three years in the period ended June 30, 2008 in conformitywith International Financial Reporting Standards as issued by the International AccountingStandards Board. Also in our opinion, the Company maintained, in all material respects, effectiveinternal control over financial reporting as of June 30, 2008, based on criteria established inInternal Control — Integrated Framework issued by the Committee of Sponsoring Organizations of theTreadway Commission (COSO). The Company’s management is responsible for these financialstatements, for maintaining effective internal control over financial reporting and for itsassessment of the effectiveness of internal control over financial reporting, included inManagement’s Annual Report on Internal Control over Financial Reporting appearing under Item 15(b). Our responsibility is to express opinions on these financial statements and on the Company’sinternal control over financial reporting based on our audits (which were integrated audits for theyears ended June 30, 2008 and 2007). We conducted our audits in accordance with the standards ofthe Public Company Accounting Oversight Board (United States). Those standards require that weplan and perform the audits to obtain reasonable assurance about whether the financial statementsare free of material misstatement and whether effective internal control over financial reportingwas maintained in all material respects. Our audits of the financial statements includedexamining, on a test basis, evidence supporting the amounts and disclosures in the financialstatements, assessing the accounting principles used and significant estimates made by management,and evaluating the overall financial statement presentation. Our audit of internal control overfinancial reporting included obtaining an understanding of internal control over financialreporting, assessing the risk that a material weakness exists, and testing and evaluating thedesign and operating effectiveness of internal control based on the assessed risk. Our audits alsoincluded performing such other procedures as we considered necessary in the circumstances. Webelieve that our audits provide a reasonable basis for our opinions.
A company’s internal control over financial reporting is a process designed to providereasonable assurance regarding the reliability of financial reporting and the preparation offinancial statements for external purposes in accordance with generally accepted accountingprinciples. A company’s internal control over financial reporting includes those policies andprocedures that (i) pertain to the maintenance of records that, in reasonable detail, accuratelyand fairly reflect the transactions and dispositions of the assets of the company; (ii) providereasonable assurance that transactions are recorded as necessary to permit preparation of financialstatements in accordance with generally accepted accounting principles, and that receipts andexpenditures of the company are being made only in accordance with authorizations of management anddirectors of the company; and (iii) provide reasonable assurance regarding prevention or timelydetection of unauthorized acquisition, use, or disposition of the company’s assets that could havea material effect on the financial statements.
Because of its inherent limitations, internal control over financial reporting may not preventor detect misstatements. Also, projections of any evaluation of effectiveness to future periodsare subject to the risk that controls may become inadequate because of changes in conditions, orthat the degree of compliance with the policies or procedures may deteriorate.
PricewaterhouseCoopers Inc
Johannesburg, Republic of South Africa
October 27, 2008
F-2
Consolidated income statementsFor the years ended June 30
| | | | | | | | | | | | | | | | | |
| | | | | | | U.S. Dollar | |
| |
| Figures in million | | Notes | | 2008 | | | 2007 | | | 2006 | |
| |
| |
Continuing operations | | | | | | | | | | | | | | | | |
Revenue | | | | | | | 1,269 | | | | 1,116 | | | | 937 | |
Cost of sales | | | 5 | | | | (1,122 | ) | | | (929 | ) | | | (909 | ) |
| |
Production costs | | | | | | | (918 | ) | | | (836 | ) | | | (778 | ) |
Amortization and depreciation | | | | | | | (117 | ) | | | (106 | ) | | | (138 | ) |
Impairment of assets | | | | | | | (40 | ) | | | 19 | | | | 30 | |
Employment termination and restructuring costs | | | | | | | (29 | ) | | | — | | | | 12 | |
Other items | | | | | | | (18 | ) | | | (6 | ) | | | (35 | ) |
| |
Gross profit | | | | | | | 147 | | | | 187 | | | | 28 | |
Corporate, administration and other expenditure | | | | | | | (31 | ) | | | (31 | ) | | | (24 | ) |
Exploration expenditure | | | | | | | (28 | ) | | | (27 | ) | | | (11 | ) |
Other (expenses)/income — net | | | 6 | | | | (15 | ) | | | 25 | | | | (97 | ) |
| |
Operating profit | | | 7 | | | | 73 | | | | 154 | | | | (104 | ) |
Loss from associates | | | 20 | | | | (11 | ) | | | (3 | ) | | | (17 | ) |
Profit on sale of investment in associate | | | 8 | | | | — | | | | 33 | | | | — | |
Impairment of investment in associate | | | 20 | | | | (12 | ) | | | — | | | | — | |
Profit on sale of investment in subsidiary | | | | | | | — | | | | — | | | | 2 | |
Fair value of non-derivative financial instruments | | | 9 | | | | 5 | | | | 15 | | | | 14 | |
(Loss)/profit on sale of listed investments | | | 10 | | | | (63 | ) | | | (5 | ) | | | 45 | |
Investment income | | | 11 | | | | 39 | | | | 27 | | | | 31 | |
Finance cost | | | 12 | | | | (70 | ) | | | (65 | ) | | | (62 | ) |
| |
(Loss)/profit before taxation | | | | | | | (39 | ) | | | 156 | | | | (91 | ) |
Taxation | | | 13 | | | | (65 | ) | | | (39 | ) | | | (22 | ) |
| |
Net (loss)/profit from continuing operations | | | | | | | (104 | ) | | | 117 | | | | (113 | ) |
| | | | | | | | | | | | | | | | |
Discontinued operations | | | | | | | | | | | | | | | | |
Profit/(loss) from discontinued operations | | | 14 | | | | 74 | | | | (66 | ) | | | 22 | |
| |
Net (loss)/profit | | | | | | | (30 | ) | | | 51 | | | | (91 | ) |
| |
| | | | | | | | | | | | | | | | |
(Loss)/earnings per ordinary share (cents): | | | 15 | | | | | | | | | | | | | |
(Loss)/profit from continuing operations | | | | | | | (26 | ) | | | 29 | | | | (29 | ) |
Profit/(loss) from discontinued operations | | | | | | | 18 | | | | (17 | ) | | | 6 | |
| |
Total (loss)/profit for the period | | | | | | | (8 | ) | | | 12 | | | | (23 | ) |
| |
| | | | | | | | | | | | | | | | |
Diluted (loss)/earnings per ordinary share(cents): | | | 15 | | | | | | | | | | | | | |
(Loss)/profit from continuing operations | | | | | | | (26 | ) | | | 29 | | | | (29 | ) |
Profit/(loss) from discontinued operations | | | | | | | 18 | | | | (17 | ) | | | 6 | |
| |
Total (loss)/profit for the period | | | | | | | (8 | ) | | | 12 | | | | (23 | ) |
| |
The accompanying notes are an integral part of these consolidated financial statements.
F-3
Consolidatedstatements of other comprehensive incomeFor the years ended June 30
| | | | | | | | | | | | | |
| | | US Dollar | |
| |
| Figures in million | | 2008 | | | 2007 | | | 2006 | |
| |
| | | | | | | | | | | | |
Net (loss)/profit for the period | | | (30 | ) | | | 51 | | | | (91 | ) |
| |
Attributable to: | | | | | | | | | | | | |
Owners of the parent | | | (30 | ) | | | 51 | | | | (91 | ) |
Non-controlling interest | | | — | | | | — | | | | — | |
| |
Other comprehensive (loss)/income for theperiod, net of income tax | | | (204 | ) | | | 41 | | | | (196 | ) |
| |
Foreign exchange translation profit and loss | | | (246 | ) | | | 87 | | | | (214 | ) |
Mark-to-market of available-for-sale investments | | | 42 | | | | (46 | ) | | | 18 | |
| |
Total comprehensive (loss)/income for the period | | | (234 | ) | | | 92 | | | | (287 | ) |
| |
Attributable to: | | | | | | | | | | | | |
Owners of the parent | | | (234 | ) | | | 92 | | | | (287 | ) |
Non-controlling interest | | | — | | | | — | | | | — | |
| |
Theaccompanying notes are an integral part of these consolidatedfinancial statements.
F-4
Consolidatedbalance sheetsAs at June 30
| | | | | | | | | | | | | |
| | | US Dollar | |
| |
| Figures in million | | Notes | | 2008 | | | 2007 | |
| |
| | | | | | | | | | | | |
Assets | | | | | | | | | | | | |
| | | | | | | | | | | | |
Non-current assets | | | | | | | | | | | | |
Property, plant and equipment | | | 16 | | | | 3,531 | | | | 3,484 | |
Intangible assets | | | 17 | | | | 283 | | | | 328 | |
Restricted cash | | | 24 | | | | 10 | | | | 1 | |
Restricted investments | | | 18 | | | | 188 | | | | 195 | |
Investments in financial assets | | | 19 | | | | 9 | | | | 8 | |
Investments in associates | | | 20 | | | | 19 | | | | 1 | |
Deferred tax asset | | | 13 | | | | 190 | | | | 216 | |
Trade and other receivables | | | 22 | | | | 18 | | | | 8 | |
| |
Total non-current assets | | | | | | | 4,248 | | | | 4,241 | |
| |
| | | | | | | | | | | | |
Current assets | | | | | | | | | | | | |
Inventories | | | 23 | | | | 89 | | | | 105 | |
Investments in financial assets | | | 19 | | | | — | | | | 353 | |
Trade and other receivables | | | 22 | | | | 112 | | | | 130 | |
Income and mining taxes | | | | | | | 11 | | | | 9 | |
Restricted cash | | | 24 | | | | — | | | | 39 | |
Cash and cash equivalents | | | 25 | | | | 53 | | | | 101 | |
| |
| | | | | | | 265 | | | | 737 | |
Non-current assets classified as held for sale | | | 14 | | | | 197 | | | | 182 | |
| |
Total current assets | | | | | | | 462 | | | | 919 | |
| |
Total assets | | | | | | | 4,710 | | | | 5,160 | |
| |
| | | | | | | | | | | | |
Equity and liabilities | | | | | | | | | | | | |
| | | | | | | | | | | | |
Share capital and reserves | | | | | | | | | | | | |
Share capital | | | 26 | | | | 3,787 | | | | 3,752 | |
Other reserves | | | 27 | | | | (196 | ) | | | 2 | |
Accumulated loss | | | | | | | (419 | ) | | | (388 | ) |
| |
Total equity | | | | | | | 3,172 | | | | 3,366 | |
| |
| | | | | | | | | | | | |
Non-current liabilities | | | | | | | | | | | | |
Borrowings | | | 28 | | | | 31 | | | | 248 | |
Deferred tax | | | 13 | | | | 573 | | | | 602 | |
Provision for environmental rehabilitation | | | 29 | | | | 145 | | | | 156 | |
Provisions for other liabilities and charges | | | 30 | | | | 18 | | | | 18 | |
| |
Total non-current liabilities | | | | | | | 767 | | | | 1,024 | |
| |
| | | | | | | | | | | | |
Current liabilities | | | | | | | | | | | | |
Trade and other payables | | | 31 | | | | 213 | | | | 257 | |
Borrowings | | | 28 | | | | 494 | | | | 405 | |
Bank overdraft | | | 25 | | | | — | | | | 31 | |
| |
| | | | | | | 707 | | | | 693 | |
| | | | | | | | | | | | |
Liabilities directly associated withnon-current assets classified as held for sale | | | 14 | | | | 64 | | | | 77 | |
| |
Total current liabilities | | | | | | | 771 | | | | 770 | |
| |
Total equity and liabilities | | | | | | | 4,710 | | | | 5,160 | |
| |
The accompanying notes are an integral part of these consolidated financial statements.
F-5
Consolidated statements of changes in shareholders’ equity
For the years ended June 30
| | | | | | | | | | | | | | | | | | | | | | | | | | | |
| | | | Number of | | | | | | | | | | | | | | | |
| | | | ordinary | | | | | | | | Share | | | Accumulated | | | Other | | | | |
| | | | shares issued | | | | Share capital | | | premium | | | loss | | | reserves | | | Total | |
| | | | | | | |
| | | | | | | | | Figures in million (US Dollar) | |
| | | | | | | |
Notes | | | | | | | | | 26 | | | | | | | | | | | | 27 | | | | | |
| | | | | | | |
Balance — June 30, 2005 (as previouslyreported) | | | | 393,341,194 | | | | | 31 | | | | 3,669 | | | | (352 | ) | | | 135 | | | | 3,483 | |
| | | | | | | | | | | | | | | | | | | | | | | | | | |
Change in accounting policy for thecapitalization of interest on assetsunder construction (note 2.1) | | | | | | | | | — | | | | — | | | | 6 | | | | — | | | | 6 | |
| | | | | | | |
Balance — June 30, 2005 (restated) | | | | 393,341,194 | | | | | 31 | | | | 3,669 | | | | (346 | ) | | | 135 | | | | 3,489 | |
Dividends declared | | | | — | | | | | — | | | | — | | | | (1 | ) | | | — | | | | (1 | ) |
Issue of shares | | | | | | | | | | | | | | | | | | | | | | | | | — | |
- Exercise of employee share options | | | | 3,593,256 | | | | | 1 | | | | 28 | | | | — | | | | — | | | | 29 | |
Deferred share-based payments | | | | — | | | | | — | | | | 3 | | | | — | | | | 16 | | | | 19 | |
Total comprehensive income for the year | | | | — | | | | | — | | | | — | | | | (91 | ) | | | (196 | ) | | | (287 | ) |
| | | | | | | |
Balance — June 30, 2006 | | | | 396,934,450 | | | | | 32 | | | | 3,700 | | | | (438 | ) | | | (45 | ) | | | 3,249 | |
| | | | | | | |
Dividends declared | | | | — | | | | | — | | | | — | | | | (1 | ) | | | — | | | | (1 | ) |
Issue of shares | | | | | | | | | | | | | | | | | | | | | | | | | | |
- Exercise of employee share options | | | | 2,673,934 | | | | | — | | | | 19 | | | | — | | | | — | | | | 19 | |
Deferred share-based payments | | | | — | | | | | — | | | | 1 | | | | — | | | | 6 | | | | 7 | |
Total comprehensive income for the year | | | | — | | | | | — | | | | — | | | | 51 | | | | 41 | | | | 92 | |
| | | | | | | |
Balance — June 30, 2007 | | | | 399,608,384 | | | | | 32 | | | | 3,720 | | | | (388 | ) | | | 2 | | | | 3,366 | |
| | | | | | | |
Dividends declared | | | | — | | | | | — | | | | — | | | | (1 | ) | | | — | | | | (1 | ) |
Issue of shares | | | | | | | | | | | | | | | | | | | | | | | | | | |
- Exercise of employee share options | | | | 1,786,213 | | | | | — | | | | 12 | | | | — | | | | — | | | | 12 | |
- Exchange for PNG Royalty | | | | 1,859,159 | | | | | — | | | | 20 | | | | — | | | | — | | | | 20 | |
Deferred share-based payments | | | | — | | | | | — | | | | 3 | | | | — | | | | 6 | | | | 9 | |
Total comprehensive income for the year | | | | — | | | | | — | | | | — | | | | (30 | ) | | | (204 | ) | | | (234 | ) |
| | | | | | | |
Balance — June 30, 2008 | | | | 403,253,756 | | | | | 32 | | | | 3,755 | | | | (419 | ) | | | (196 | ) | | | 3,172 | |
| | | | | | | |
The accompanying notes are an integral part of these consolidated financial statements.
F-6
Consolidated cash flow statements
For the years ended June 30
| | | | | | | | | | | | | | | | | |
| | | | | | | US Dollar | |
| |
| Figures in million | | Notes | | 2008 | | | 2007 | | | 2006 | |
Cash flow from operating activities | | | | | | | | | | | | | | | | |
Cash generated by operations | | | 32 | | | | 268 | | | | 164 | | | | 53 | |
Interest received | | | | | | | 38 | | | | 25 | | | | 33 | |
Dividends received | | | | | | | 5 | | | | 3 | | | | 3 | |
Interest paid | | | | | | | (57 | ) | | | (31 | ) | | | (32 | ) |
Income and mining taxes paid | | | | | | | (18 | ) | | | (2 | ) | | | (2 | ) |
| |
Cash generated by operating activities | | | | | | | 236 | | | | 159 | | | | 55 | |
| |
| | | | | | | | | | | | | | | | |
Cash flow from investing activities | | | | | | | | | | | | | | | | |
Amounts invested in restricted investments | | | | | | | (11 | ) | | | (2 | ) | | | (5 | ) |
Decrease/(increase) in restricted cash | | | | | | | 28 | | | | (4 | ) | | | (32 | ) |
Investment in Orpheo by Harmony acquired | | | 32 | | | | — | | | | — | | | | (1 | ) |
Proceeds on disposal of South Kal Mine | | | 32 | | | | 18 | | | | — | | | | — | |
Proceeds on disposals of Buffalo Creek | | | 32 | | | | — | | | | — | | | | 3 | |
Proceeds on disposal ofavailable-for-sale financial assets | | | | | | | 184 | | | | 55 | | | | 365 | |
Acquisition of associate | | | | | | | — | | | | — | | | | (321 | ) |
Increase in intangible assets | | | | | | | (3 | ) | | | (6 | ) | | | — | |
(Increase)/decrease in other non-currentinvestments | | | | | | | (11 | ) | | | (5 | ) | | | 3 | |
Proceeds on disposal of property, plantand equipment | | | | | | | 18 | | | | 27 | | | | 13 | |
Additions to property, plant and equipment | | | | | | | (552 | ) | | | (383 | ) | | | (275 | ) |
| |
Cash utilized by investing activities | | | | | | | (329 | ) | | | (318 | ) | | | (250 | ) |
| |
| | | | | | | | | | | | | | | | |
Cash flow from financing activities | | | | | | | | | | | | | | | | |
Long-term borrowings raised | | | | | | | 323 | | | | 253 | | | | 160 | |
Long-term borrowings paid | | | | | | | (256 | ) | | | (139 | ) | | | (205 | ) |
Ordinary shares issued | | | | | | | 12 | | | | 19 | | | | 29 | |
Dividends paid | | | | | | | (1 | ) | | | (1 | ) | | | (1 | ) |
| |
Cash generated by financing activities | | | | | | | 78 | | | | 132 | | | | (17 | ) |
| |
| | | | | | | | | | | | | | | | |
Foreign currency translation adjustments | | | | | | | (2 | ) | | | 6 | | | | 36 | |
| |
| | | | | | | | | | | | | | | | |
Net decrease in cash and equivalents | | | | | | | (17 | ) | | | (21 | ) | | | (176 | ) |
Cash and equivalents — beginning of period | | | | | | | 70 | | | | 91 | | | | 267 | |
| |
Cash and equivalents — end of period | | | 25 | | | | 53 | | | | 70 | | | | 91 | |
| |
The accompanying notes are an integral part of these consolidated financial statements.
F-7
Notes to the consolidated financial statements
For the years ended June 30
| 1 | | General information |
| |
| | | Harmony Gold Mining Company Limited (“the Company”) and its subsidiaries (collectively “Harmony”or “the Group”) are engaged in gold mining and related activities, including exploration,extraction and processing. Gold bullion, the Group’s principal product, is currently produced atits operations in South Africa. As discussed in note 14, Harmony classified its Australianoperations as non-current assets held for sale. One of these operations were disposed of during the2008 financial year. |
| |
| | | The Company is a public company, incorporated and domiciled in South Africa. The address of theregistered office is Randfontein Office Park, Corner Main Reef Road and Ward Avenue, Randfontein,1759. |
| |
| | | These consolidated financial statements were authorized for issue by the board of directors onOctober 10, 2008. |
| 2 | | Accounting policies |
| |
| | | The principal accounting policies applied in the preparation of the consolidated financialstatements are set out below. These policies have been consistently applied in all years presented.IAS 23 (Revised) and IFRS 8 have been retrospectively applied. |
| | 2.1 | | Basis of preparation |
| |
| | | | The annual financial statements are prepared on the historical cost basis, as modified byavailable-for-sale financial assets, and financial assets and liabilities, which have been broughtto account at fair value. The financial statements are prepared in accordance with InternationalFinancial Reporting Standards (“IFRS”) as issued by the International Accounting Standards Board(“IASB”). |
| |
| | | | New accounting standards and interpretations |
| |
| | | | During the current financial year, the following new and revised accounting standards, amendmentsto standards and new interpretations were adopted by the Group: |
| |
| | | | IFRS 7 — Financial Instruments : Disclosure |
| |
| | | | In addition, the following new and revised accounting standards and amendments to standards wereearly adopted by the Group during the current financial year: |
| |
| | | | IAS 1 (Revised) — Presentation of Financial Statements |
| |
| | | | IAS 23 (Revised) — Borrowing Costs |
| |
| | | | IFRS 8 — Operating Segments |
| |
| | | | The effect of the adoption of these standards and amendments to standards are as follows: |
| |
| | | | IFRS 7 — Financial Instruments: Disclosure |
| |
| | | | The Group adopted this standard as of July 1, 2007. The standard introduces new disclosures toimprove the information regarding financial instruments. It requires the disclosures of qualitativeand quantitative information about the exposure to risks arising from financial instruments,including a sensitivity analysis to market risk. There was no effect on the financial position orperformance of the Group as a result of the adoption of this standard. |
| |
| | | | IAS 1 (Revised) — Presentation of Financial Statements |
| |
| | | | The Group early adopted this amendment as of July 1, 2007. The amendment requires that changes inequity resulting from transactions with owners (holders of instruments classified as equity) bepresented separately from non-owner changes in equity (also known as other comprehensive income).There are also additional disclosures for components of other comprehensive income. There was noeffect on the financial position or performance of the Group as a result of the adoption of thisamendment. |
| |
| | | | IAS 23 (Revised) — Borrowing Costs |
| |
| | | | The Group early adopted the revised standard on Borrowing Costs as of July 1, 2007. The standardrequires that all borrowing costs that are directly attributable to the acquisition, constructionor production of a qualifying asset be capitalized as part of the cost of the asset. All otherborrowing costs are recognized as an expense in the period in which they are incurred. |
| |
| | | | In accordance with the revised standard’s transitional provisions, the Group designated July 1,2000 (the earliest commencement date of current qualifying projects) as the effective date andapplied the requirements of the revised standard to all qualifying projects for which thecommencement date of capitalization was on or after that date. |
F-8
| | | | The impact of the adjustment was as follows: |
| | | | | | | | | | | | | |
| | | US Dollar | |
| |
| Figures in million | | 2008 | | | 2007 | | | 2006 | |
| | | | | | | | | | | | | |
Effect on net loss: | | | | | | | | | | | | |
Decrease in finance cost | | | 18 | | | | 8 | | | | 4 | |
Income tax | | | (5 | ) | | | (2 | ) | | | (1 | ) |
| |
| | | 13 | | | | 6 | | | | 3 | |
| |
| | | | | | | | | | | | |
Effect on Earnings per share (cents): | | | | | | | | | | | | |
Basic earnings per share | | | 3 | | | | 2 | | | | 1 | |
Diluted earnings per share | | | 3 | | | | 2 | | | | 1 | |
| | | | | | | | | | | | |
Effect on opening accumulated loss: | | | | | | | | | | | | |
Decrease in finance cost | | | | | | | | | | | 9 | |
Income tax | | | | | | | | | | | (3 | ) |
| |
Decrease in accumulated loss | | | | | | | | | | | 6 | |
| |
| | | | The average capitalization rate was 10.6% for 2008 (2007: 6.7%; 2006: 7.3%). |
| |
| | | | IAS 1 (Revised) requires the presentation of a balance sheet as at the beginning of the earliestcomparative period whenever the Group applies an accounting policy retrospectively. Such a balancesheet has been included in note 38. |
| |
| | | | IFRS 8 — Operating Segments |
| |
| | | | The Group early adopted this standard as of July 1, 2007. The standard replaces IAS 14, “SegmentReporting”, and aligns segment reporting with the requirements of the US GAAP standard SFAS 131,“Disclosures about segments of an enterprise and related information”. The new standard requires a“management approach”, under which segment information is presented on the same basis as that usedfor internal reporting to the chief operating decision maker. |
| |
| | | | At the date of authorization of these financial statements, the standards, amendments andinterpretations listed below were in issue but not yet effective. These new standards, amendmentsand interpretations have not been early adopted by the Group and a reliable estimate of the impactof the adoption thereof for the Group cannot yet be determined for all of them, as management isstill in the process of determining the impact of these standards and interpretations on futurefinancial statements. |
| | | | | | | |
| Title | | | | Effective date | | |
| Amendments |
• | | IAS 1 (Amendment) and IAS 32 (Amendment) — Puttable Financial Instruments and Obligations arising on Liquidation | | ^ Financial year commencing on or after January 1, 2009 | | |
• | | IAS 27 (Revised) — Consolidated and Separate Financial Statements | | # Financial year commencing on or after July 1, 2009 | | |
• | | IAS 27 (Amendment) and IFRS 1 (Amendment) — Cost of an Investment in a Subsidiary, Jointly Controlled Entity or Associate | | # Financial year commencing on or after January 1, 2009 | | |
• | | IAS 39 (Amendment) — Eligible Hedged items | | ^ Financial year commencing on or after July 1, 2009 | | |
• | | IFRS 2 (Amendment) — Vesting conditions and cancellations | | # Financial year commencing on or after January 1, 2009 | | |
• | | IFRS 3 (Revised) — Business Combinations | | # Financial year commencing on or after July 1, 2009 | | |
• | | Annual improvements to IFRS | | # Financial year commencing on or after July 1, 2009 | | |
| | | | | | |
| New interpretations |
• | | IFRIC 14 — IAS19 The Limit on a Defined Benefit asset, Minimum Funding Requirements and their interactions | | ^ Financial year commencing on or after January 1, 2008 | | |
• | | IFRIC 16 — Hedges of a Net Investment in a Foreign Operation | | ^ Financial year commencing on or after October 1, 2008 | | |
| | | | The Group plans to apply the above new standards, amendments and interpretations on their respective effective dates. |
| | |
| # | | The impact of the standard/amendment/interpretation is not currently known or reasonably estimable. |
| |
| ^ | | The standard/amendment/interpretation is not expected to have a material impact on the Group’s financial statements. |
F-9
| | 2.2 | | Consolidation |
| |
| | | | The consolidated financial information includes the financial statements of the Company, itssubsidiaries, its proportionate interest in joint ventures, special purpose entities (SPE’s) andits interests in associates. |
| | (i) | | Subsidiaries, which are those entities in which the Group has an interest of more thanone half of the voting rights or otherwise has power to govern the financial and operatingpolicies, are consolidated. Subsidiaries are consolidated from the date on which control isacquired and are no longer consolidated when control ceases. The purchase method of accounting isused to account for the acquisition of subsidiaries. The cost of an acquisition is measured as thefair value of the assets given up, shares issued or liabilities assumed at the date of acquisitionplus costs directly attributable to the acquisition. |
| |
| | | | Identifiable assets acquired and liabilities and contingent liabilities assumed in a businesscombination are measured initially at their fair values at the acquisition date, irrespective ofthe extent of any non-controlling interests. Non-controlling interests are carried at a proportionof the net identifiable assets acquired. |
| |
| | | | The excess of the cost of acquisition over the fair value of the Group’s share of the identifiablenet assets acquired is recorded as goodwill (refer to 2.7). |
| |
| | | | In situations of successive share purchases when control already existed at the date of furtheracquisition, no fair value adjustment is made to the identifiable net assets acquired and anyexcess/deficit purchase price over the carrying value of non-controlling interests acquired isaccounted for in equity. |
| |
| | | | Intercompany transactions, balances and unrealized gains on transactions between group companiesare eliminated on consolidation. Unrealized losses are also eliminated and may provide evidence ofan impairment that should be recognized. Where necessary, accounting policies of subsidiaries havebeen changed to ensure consistency with the policies adopted by the Group. |
| |
| | (ii) | | Associates are those entities, other than a subsidiary, in which the Group has a material interestand in respect of which the Group exercises significant influence over operational and financialpolicies, normally owning between 20% and 50% of the voting equity, but which it does not control. |
| |
| | | | Investments in associates are accounted for by using the equity method of accounting, and areinitially recognized at cost. The cost of an acquisition is measured as the fair value of theassets given up, shares issued or liabilities assumed at the date of acquisition plus costsdirectly attributable to the acquisition. |
| |
| | | | The Group’s share of the associates’ post-acquisition profits or losses is recognized in the incomestatement, and its share of post-acquisition movement in reserves is recognized in other reserves.Cumulative post-acquisition movements are adjusted against the carrying amount of the investment.When the Group’s shares of losses in an associate equals or exceeds its interest in the associate,including any other unsecured receivables, the Group does not recognize further losses, unless ithas incurred obligations or made payments on behalf of the associate. |
| |
| | | | The Group’s investment in associates includes goodwill identified on acquisition. |
| |
| | | | The carrying value of an associate is reviewed on a regular basis and, if an impairment in thecarrying value has occurred, it is written off in the period in which such impairment isidentified. |
| |
| | | | Unrealized gains on transactions between the Group and its associates are eliminated to the extentof the Group’s interest in the associates. Unrealized losses are also eliminated and may provideevidence of an impairment that should be recognized. |
| |
| | | | Accounting policies of associates have been reviewed to ensure consistency with the policiesadopted by the Group. |
| |
| | (iii) | | Joint ventures are those entities in which the Group holds a interest and which is jointlycontrolled by the Group and one or more ventures under a contractual arrangement. The Group’sinterest in jointly controlled entities is accounted for by proportionate consolidation. Under thismethod, the Group includes its share of the joint venture’s individual income and expenses, assetsand liabilities and cash flows on a line-by-line basis with similar items in the Group’s financialstatements. |
| |
| | | | The Group recognizes the portion of gains or losses on the sale of assets by the Group to the jointventure that is attributable to the other ventures. The Group does not recognize its share ofprofits or losses from the joint venture that results from the purchase of assets by the Group fromthe joint venture until it resells the assets to an independent party. However, if a loss on thetransaction provides evidence of a reduction in the net realizable value of current assets or animpairment loss, the loss is recognized immediately. |
F-10
| | (iv) | | Special purpose entities (SPE’s) are those undertakings that are created to satisfy specificbusiness needs of the Group, These are consolidated where the Group has the right to the majorityof the benefits of the SPE and/or is exposed to the majority of the risk thereof.SPE’s are consolidated in the same manner as subsidiaries when the substance of the relationshipindicates that the SPE is controlled by the Group. |
| | 2.3 | | Foreign currency transactions |
| | (i) | | Functional and presentation currency: Items included in the financial statements of each of theGroup’s entities are measured using the currency of the primary economic environment in which theentity operates (the functional currency). The functional currency of the Company is the SouthAfrican Rand. The presentation currency of these financial statements is the US Dollar. |
| |
| | | | References to “A$” refers to Australian currency,“R” or “Rand” to South African currency, “$” or “US$” toUnited States currency and “K” or “Kina” to Papua New Guinea currency. |
| |
| | (ii) | | Transactions and balances: Foreign currency transactions are translated into the functionalcurrency using the exchange rates prevailing at the dates of the transactions. Foreign exchangegains and losses resulting from the settlement of such transactions and from the translation toyear-end exchange rates of monetary assets and liabilities denominated in foreign currencies arerecognized in the income statement. These transactions are included in the determination of other(expenses)/income — net. |
| |
| | | | Changes in the fair value of monetary securities denominated in a foreign currency classified asavailable-for-sale are analyzed between translation differences resulting from changes in theamortized cost of the security, and other changes in the carrying amount of the security.Translation differences are recognized in profit or loss, and other changes in carrying amount arerecognized in other reserves. |
| |
| | | | Translation differences on non-monetary financial assets and liabilities such as equities held atfair value through profit or loss are recognized in profit or loss as part of the fair value gainor loss. Translation differences on non-monetary financial assets such as equities classified asavailable-for-sale are included in other comprehensive income. |
| |
| | (iii) | | Group companies: The results and financial position of all Group entities (none of which has thecurrency of a hyperinflationary economy) that have a functional currency different from thepresentation currency are translated into the presentation currency as follows: |
| | a) | | assets and liabilities for each balance sheet presented are translated at the closing rate atthe date of that balance sheet; |
| |
| | b) | | income and expenses for each income statement are translated at average exchange rates (unlessthis average is not a reasonable approximation of the cumulative effect of the rates prevailing onthe transaction dates, in which case income and expenses are translated at the rate on the date ofthe transactions); |
| |
| | c) | | all resulting exchange differences are recognized as a separate component of other reserves.d) equity items are translated at historic rates. |
| |
| | d) | | equity items are translated at historic rates. |
| | | | On consolidation, exchange differences arising from the translation of the net investment inforeign operations, and of borrowings and other currency instruments designated as hedges of suchinvestments, are taken to other reserves. When a foreign operation is sold, exchange differencesthat were recorded in equity are recognized in profit or loss as part of the gain or loss on sale. |
| |
| | | | Goodwill and fair value adjustments arising on the acquisition of a foreign operation are treatedas assets and liabilities of the foreign operation and translated at the closing rate. |
| | 2.4 | | Segmental reporting |
| |
| | | | Operating segments are reported in a manner consistent with the internal reporting provided to thechief operating decision-maker. The chief operating decision-maker has been identified as theexecutive committee. The accounting policies of the segments are the same as those described in theaccounting policy notes to the financial statements. |
F-11
| | 2.5 | | Property, plant and equipment |
| | (i) | | Mining assets including mine development costs and mine plant facilities are initially recorded atcost, where after it is measured at cost less accumulated amortization and impairment. |
| |
| | | | At the Group’s surface mines, when it has been determined that a mineral property can beeconomically developed as a result of establishing proven and probable reserves, costs incurred todevelop the property are capitalized as incurred until the mine is considered to have moved intothe production phase, and are amortized using the units-of-production method over the estimatedlife of the ore body based on estimated recoverable ounces or pounds mined from proven and probablereserves. These costs include costs to further delineate the ore body and remove overburden toinitially expose the ore body. Stripping costs incurred during the production phase to remove wasteore are deferred and charged to production costs on the basis of the average life-of-mine strippingratio. The average stripping ratio is calculated as the number of tonnes of waste material removedper tonne of ore mined. The average life-of-mine ratio is revised annually in the light ofadditional knowledge and change in estimates. The cost of “excess stripping” is capitalized as minedevelopment costs when the actual stripping ratio exceeds the average life of mine stripping ratio.Where the average life of mine stripping ratio exceeds the actual stripping ratio, the cost ischarged to the income statement. |
| |
| | | | At the Group’s underground mines, all costs incurred to develop the property, including costs toaccess specific ore blocks or other areas of the underground mine, are capitalized to the extentthat such costs will provide future economic benefits as a result of establishing proven andprobable reserves associated with specific ore blocks or areas of operations. These costs includethe cost of shaft sinking and access, the costs of building access ways, lateral development, driftdevelopment, ramps, box cuts and other infrastructure development. |
| |
| | | | Borrowing costs are capitalized to the extent that they are directly attributable to theacquisition and construction of qualifying assets. Qualifying assets are assets that take asubstantial time to get ready for their intended use. These costs are capitalized until the assetmoves into the production phase. Other borrowing costs are expensed. |
| |
| | | | The net assets of operations placed on care and maintenance are impaired to their recoverableamount. Expenditure on the care and maintenance of these operations is charged against income, asincurred. |
| |
| | | | Where a depreciable asset is used in the construction or extension of a mine, the depreciation iscapitalized against the mines cost. |
| |
| | (ii) | | Non-mining assets: Land is shown at cost and not depreciated. Other non-mining fixed assets areshown at cost less accumulated depreciation and accumulated impairment losses. |
| |
| | (iii) | | Undeveloped properties are initially valued at the fair value of resources obtained throughacquisitions. The carrying value of these properties are annually tested for impairment. Oncedevelopment commences, these properties are transferred to mining properties and accounted for inaccordance with the related accounting policy. |
| |
| | (iv) | | Mineral and surface use rights represent mineral and surface use rights for parcels of land bothowned and not owned by the Group. Mineral and surface rights include acquired mineral use rights inproduction, development and exploration phase properties. The amount capitalized related to amineral and surface right represents its fair value at the time it was acquired, either as anindividual asset purchase or as part of a business combination, and is recorded at cost ofacquisition. |
| |
| | | | Production phase mineral interests represent interests in operating properties that contain provenand probable reserves. Development phase mineral interests represent interests in properties underdevelopment that contain proven and probable reserves. Exploration phase mineral interestsrepresent interests in properties that are believed to potentially contain (i) other mineralizedmaterial such as inferred material within pits; measured, indicated and inferred material withinsufficient drill spacing to qualify as proven and probable reserves; (ii) around-mine explorationpotential such as inferred material not immediately adjacent to existing reserves andmineralization but located within the immediate mine infrastructure; (iii) other mine-relatedexploration potential that is not part of measured, indicated or inferred material and is comprisedmainly of material outside of the immediate mine area; or (iv) Greenfield exploration potentialthat is not associated with any production, development or exploration phase property as describedabove. |
| |
| | | | The Group’s mineral use rights are enforceable regardless of whether proven or probable reserveshave been established. In certain limited situations, the nature of mineral use rights change fromexploration rights to mining rights upon the establishment of proven and probable reserves. TheGroup has the ability and intent to renew mineral use rights where the existing term is notsufficient to recover all identified and valued proven and probable reserves and/or undevelopedmineral interests. |
F-12
| | (v) | | Leased assets: The Group leases certain property, plant and equipment. Leases of property,plant and equipment where the Group has substantially all the risks and rewards of ownership areclassified as finance leases. The assets are capitalized at the lease’s commencement at the lowerof the fair value of the leased property and the present value of the minimum lease payments. |
| |
| | | | Finance lease payments are allocated using the rate implicit in the lease, which is included infinance costs, and the capital repayment, which reduces the liability to the lessor. Thecorresponding rental obligations, net of finance charges, are included in Borrowings, with thecurrent portion included under Current Liabilities. |
| |
| | | | Capitalized lease assets are depreciated over the shorter of their estimated useful lives and thelease terms. |
| |
| | (vi) | | Depreciation and amortization of mining assets: Depreciation and amortization of mineralproperty interests, mineral and surface rights, mine development costs and mine plant facilitiesare computed principally by the units of production method based on estimated proven and probablereserves. Changes in management’s estimates of the quantities of economically recoverable reservesimpact amortization and depreciation on a prospective basis. |
| |
| | | | Costs incurred and capitalized to enable access to specific ore blocks or areas of the mine, andwhich only provide an economic benefit over the period of mining that ore block or area, areamortized using the units-of-production method where the denominator is estimated recoverableounces of gold contained in proven and probable reserves within that ore block or area. |
| |
| | | | If capitalized underground development costs provide an economic benefit over the entirelife-of-mine, the costs are amortized using the unit-of-production method, where the denominator isthe estimated recoverable ounces of gold contained in total accessible proven and probablereserves. |
| |
| | | | Proven and probable ore reserves reflect estimated quantities of economically recoverable reserveswhich can be recovered in future from known mineral deposits. Amortization is first charged onmining ventures from the date on which the mining ventures are considered to have moved into theproduction phase. |
| |
| | (vii) | | Depreciation and amortization of non-mining fixed assets: Other non-mining fixed assets aredepreciated on a straight line basis over their estimated useful lives as follows: |
| | • | | Vehicles at 20% per year; |
| |
| | • | | Computer equipment at 33.3% per year; |
| |
| | • | | Furniture and equipment at 16.67% per year. |
| | | | The assets’ residual values and useful lives are reviewed, and adjusted if appropriate, at eachbalance sheet date. |
| |
| | | | Gains and losses on disposals are determined by comparing proceeds with carrying amount. These areincluded in the income statement. |
| |
| | (viii) | | Depreciation and amortization of mineral and surface use rights: Mineral rights associated with production phasemineral interests are amortized over the life of mine using the units-of-production method in orderto match the amortization with the expected underlying future cash flows. Mineral interestsassociated with development and exploration phase mineral interests are not amortized until suchtime as the underlying property is converted to the production stage. |
| | 2.6 | | Exploration costs |
| |
| | | | The Group expenses all exploration and evaluation expenditures until the directors conclude that afuture economic benefit is more likely to be realized than not, i.e. “probable”. The informationthat the directors use to make that determination depends on the level of exploration as well asthe degree of confidence in the ore body. |
| |
| | | | Exploration and evaluation expenditure on Greenfield sites, being those where the Group does nothave any mineral deposits which are already being mined or developed, is expensed as incurred untila final feasibility study has been completed, after which the expenditure is capitalized withindevelopment costs if the final feasibility study demonstrates that future economic benefits areprobable. |
| |
| | | | Exploration and evaluation expenditure on Brownfield sites, being those adjacent to mineraldeposits which are already being mined or developed, is expensed as incurred until the directorsare able to demonstrate that future economic benefits are probable through the completion of aprefeasibility study, after which the expenditure is capitalized as a mine development cost. A“prefeasibility study” consists of a comprehensive study of the viability of a mineral project thathas advanced to a stage where the mining method, in the case of underground mining, or the pitconfiguration, in the case of an open pit, has been established, and which, if an effective methodof mineral processing has been determined, includes a financial analysis based on reasonableassumptions of technical, engineering, operating economic factors and the evaluation of otherrelevant factors. The prefeasibility study, when combined with existing knowledge of the mineralproperty that is adjacent to mineral deposits that are already being mined or developed, allows thedirectors to conclude that it is more likely than not that the Group will obtain future economicbenefit from the expenditures. |
F-13
| | | | Exploration and evaluation expenditure relating to extensions of mineral deposits which are alreadybeing mined or developed, including expenditure on the definition of mineralization of such mineraldeposits, is capitalized as a mine development cost following the completion of an economicevaluation equivalent to a feasibility study. This economic evaluation is distinguished from afeasibility study in that some of the information that would normally be determined in afeasibility study is instead obtained from the existing mine or development. This information whencombined with existing knowledge of the mineral property already being mined or developed allow thedirectors to conclude that more likely than not the Group will obtain future economic benefit fromthe expenditures. Costs relating to property acquisitions are also capitalized. These costs arecapitalized within development costs. |
| |
| | 2.7 | | Intangible assets |
| |
| | | | Intangible assets consist of all identifiable non-monetary assets without physical substance. Theyare stated at cost less accumulated amortization and accumulated impairment losses, if any. Thefollowing are the main categories of intangible assets: |
| | (i) | | Intangible assets with an indefinite useful life |
| |
| | | | Intangible assets with an indefinite useful life are not amortized but tested for impairment on anannual basis. Goodwill represents the excess of the cost of an acquisition over the fair value ofthe Group’s share of the net assets of the acquired subsidiary, associate, joint venture orbusiness at the date of acquisition. Goodwill on acquisition of subsidiaries, joint ventures andbusinesses are included in intangible assets. Goodwill on acquisition of associates is included ininvestments in associates and tested for impairment as part of the overall balance. |
| |
| | | | Goodwill is tested annually for impairment and carried at cost less accumulated impairment losses.Impairment losses on goodwill are not reversed. The impairment testing is performed on April 30. |
| |
| | | | Goodwill is allocated to cash-generating units for the purpose of impairment testing. Theallocation is made to those cash-generating units or groups of cash-generating units that areexpected to benefit from the business combination in which the goodwill arose. If the compositionof one or more cash-generating units to which goodwill has been allocated changes due to areorganisation, the goodwill is reallocated to the units affected. |
| |
| | | | The gain or loss on disposal of an entity includes the carrying amount of goodwill relating to theentity sold. |
| |
| | (ii) | | Intangible assets with a finite useful life |
| |
| | | | Acquired computer software licenses are capitalized on the basis of costs incurred to acquire andbring to use the specific software. Intangible assets with a finite useful life are amortized on astraight line basis of over their estimated useful lives, which are reviewed annually, as follows: |
| | • | | Computer software at 20% per year. |
| | 2.8 | | Impairment of non-financial assets |
| |
| | | | Assets that have an indefinite useful life are not subject to amortization and are tested annuallyfor impairment. |
| |
| | | | Assets that are subject to amortization are reviewed for impairment whenever events or changes incircumstances indicate that the carrying amount may not be recoverable. |
| |
| | | | An impairment loss is recognized for the amount by which the asset’s carrying amount exceeds itsrecoverable amount. The recoverable amount is the higher of an asset’s fair value less costs tosell and value in use. For the purposes of assessing impairment, assets are grouped at the lowestlevels for which there are separately identifiable cash flows (cash generating units). Eachoperating shaft, along with allocated common assets such as plants and administrative offices, isconsidered to be a cash generating unit as each shaft is largely independent from the cash flows ofother shafts and assets belonging to the Group. |
| |
| | | | The assets’ recoverable amount is generally determined using discounted estimated future cashflows. Future cash flows are estimated based on quantities of recoverable minerals, expected goldprices (considering current and historical prices, price trends and related factors), productionlevels and cash costs of production, all based on life-of-mine plans. |
| |
| | | | The term “recoverable minerals” refers to the estimated amount of gold that will be obtained fromproven and probable reserves and all related exploration stage mineral interests (except for othermine-related exploration potential and Greenfields exploration potential discussed separatelybelow) after taking into account losses during ore processing and treatment. Estimates ofrecoverable minerals from such related exploration stage mineral interests will be risk adjustedbased on management’s relative confidence in such materials. In estimating future cash flows,assets are grouped at the lowest level for which there are identifiable cash flows that are largelyindependent of cash flows from other asset groups. With the exception of other mine-relatedexploration potential and Greenfields exploration potential, estimates of future undiscounted cashflows are included on an area of interest basis, which generally represents an individual operatingmine, even if the mines are included in a larger mine complex. |
F-14
| | | | In the case of mineral interests associated with other mine-related exploration potential andGreenfields exploration potential, cash flows and fair values are individually evaluated basedprimarily on recent exploration results and recent transactions involving sales of similarproperties, if any. Assumptions underlying future cash flow estimates are subject to significantrisks and uncertainties. |
| |
| | | | Non-financial assets other than goodwill that suffered an impairment are reviewed for possiblereversal of the impairment at each reporting date. |
| |
| | 2.9 | | Financial instruments |
| |
| | | | Financial instruments are initially measured at fair value when the Group becomes a party to theircontractual arrangements. Transaction costs are included in the initial measurement of financialinstruments, with the exception of financial instruments classified as at fair value through profitor loss. The subsequent measurement of financial instruments is discussed below. |
| |
| | | | A financial asset is derecognized when the right to receive cash flows from the asset has expiredor the Group has transferred its rights to receive cash and either (a) has transferredsubstantially all the risks and rewards of the asset, or (b) has neither transferred nor retainedsubstantially all the risks and rewards of the asset, but has transferred control of the assets. |
| |
| | | | A financial liability is derecognized when the obligation under the liability is discharged,cancelled or expires. |
| |
| | | | On derecognition of a financial asset, the difference between the carrying amount and the sum ofthe consideration received and any cumulative gain or loss recognized in equity is recognized inprofit and loss. |
| |
| | | | On derecognition of a financial liability, the difference between the carrying amount of theliability extinguished or transferred to another party and the amount paid is recognized in profitand loss. |
| |
| | | | Financial assets |
| |
| | | | The Group classifies its financial assets in the following categories: loans and receivables,available-for-sale, held-to-maturity and at fair value through profit or loss. The classificationdepends on the purpose for which the financial assets were acquired. Management determines theclassification of its financial assets at initial recognition. |
| |
| | | | Purchases and sales of financial assets are recognized on trade-date, the date on which the Groupcommits to purchase or sell the asset. |
| | (i) | | Loans and receivables, are non-derivative financial assets with fixed or determinable payments thatare not quoted in an active market. They arise when the Group provides money, goods or servicesdirectly to a debtor with no intention of trading the receivable. Loans and receivables aresubsequently measured at amortized cost using the effective interest method. They are included incurrent assets, except for those with maturities greater than 12 months after the balance sheetdate which are classified as non-current assets. Loans and receivables include trade and otherreceivables (excluding VAT and prepayments), restricted cash and cashand cash equivalents. |
| |
| | | | Cash and cash equivalents |
| |
| | | | Cash and cash equivalents are defined as cash on hand, deposits held at call with banks andshort-term highly liquid investments with original maturities of three months or less. Cash andcash equivalents exclude restricted cash (discussed below). |
| |
| | | | Restricted cash |
| |
| | | | Restricted cash consists of cash held for performance bonds, as security deposits on miningtenements, cash held to acquire shares in subsidiaries as part of the compulsory takeover of sharesas well as cash held on margin call in terms of certain conditions of borrowing agreements. |
| |
| | | | Trade and other receivables |
| |
| | | | Trade and other receivables are recognized initially at fair value and subsequently measured atamortized cost using the effective interest method, less provision for impairment. A provision forimpairment of receivables is established when there is objective evidence that the Group will notbe able to collect all amounts due according to the original terms of receivables. Significantfinancial difficulties of the debtor, probability that the debtor will enter bankruptcy orfinancial reorganization, and default or delinquency in payments are considered indicators that thetrade receivable is impaired. The amount of the provision is the difference between the asset’scarrying amount and the present value of estimated future cash flows, discounted at the effectiveinterest rate. The carrying amount of the asset is reduced through the use of a provision forimpairment (allowance account) and the amount of the loss is recognized in the income statement.When a trade receivable is uncollectible, it is written off against the allowance account for tradereceivables. Subsequent recoveries of amounts previously written off are credited in the incomestatement. |
F-15
| | (ii) | | Available-for-sale financial assets, are non-derivatives that are either designated in thiscategory or not classified in any of the other categories. They are included in non-current assetsunless management intends to dispose of the investment within 12 months of the balance sheet date. |
| |
| | | | Available-for-sale financial assets are subsequently carried at fair value. Changes in thefair value of monetary securities denominated in a foreign currency and classified asavailable-for-sale are analyzed between translation differences resulting from changes in amortizedcost of the security and other changes in the carrying amount of the security. The translationdifferences on monetary securities are recognized in profit or loss, while translation differenceson non-monetary securities are recognized in other reserves. Changes in the fair value of monetaryand non-monetary securities classified as available-for-sale are recognized in other reserves. |
| |
| | | | When securities classified as available-for-sale are sold or impaired, the accumulated fair valueadjustments recognized in other comprehensive income are reclassified in the income statement asprofit or loss on sale of listed investments. Dividends on available-for-sale equity instrumentsare recognized in the income statement as part of investment income when the Group’s right toreceive payments is established. |
| |
| | | | The fair values of quoted investments are based on current bid prices. If the value for a financialinstrument cannot be obtained from an active market, the Group establishes fair value by usingvaluation techniques. These include the use of recent arm’s length transactions, reference to otherinstruments that are substantially the same, discounted cash flow analysis, and option pricingmodels refined to reflect the issuer’s specific circumstances. The valuation techniques makemaximum use of market inputs and rely as little as possible on entity-specific inputs. |
| |
| | | | The Group assesses at each balance sheet date whether there is objective evidence that a financialasset or a group of financial assets is impaired. In the case of equity securities classified asavailable-for-sale, a significant or prolonged decline in the fair value of the security below itscost is considered in determining whether the securities are impaired. If, in the opinion of thedirectors, permanent diminution in value exists for available-for-sale financial assets, thecumulative loss — measured as the difference between the acquisition cost and the current fairvalue, less any impairment loss on that financial asset previously recognized in profit or loss —is removed from other reserves and recognized in the income statement. Impairment losses recognizedin the income statement on equity instruments are not reversed through the income statement. |
| |
| | (iii) | | Held-to-maturity investments are non-derivative financial assets with fixed or determinablepayments and fixed maturities that the Group’s management has the positive intention and ability tohold to maturity. The Group’s held-to-maturity investments are subsequently measured at amortizedcost using the effective interest method. |
| |
| | | | The restricted investments (refer note 18) are classified as held-to-maturity investments. |
| |
| | (iv) | | Financial assets at fair value through profit or loss Financial assets at fair value throughprofit or loss have two sub-categories: financial assets held-for-trading, and those designated atfair value through profit and loss at inception. A financial asset is classified in this categoryif acquired principally for the purpose of selling in the short term or if so designated bymanagement in terms of specified criteria. Derivatives are also categorized as held-for-tradingunless they are designated as hedges. Assets in this category are classified as current assets ifthey are either held-for-trading or are expected to be realized within 12 months ofthe balance sheet date. These assets are subsequently measured at fair value with gains or lossesarising from changes in fair value recognized in the income statement in the period in which theyarise. |
| | | | Financial liabilities |
| |
| | | | Borrowings |
| |
| | | | Borrowings are initially recognized at fair value net of transaction costs incurred andsubsequently measured at amortized cost, comprising original debt less principal payments andamortization, using the effective yield method. |
| |
| | | | The fair value of the liability portion of a convertible bond is determined using a market interestrate for an equivalent non-convertible bond. This amount is recorded as a liability on an amortizedcost basis until extinguished on conversion or maturity of the bonds. The remainder of the proceedsare allocated to the conversion option. This is recognized and included in equity, net of incometax effects. |
| |
| | | | Borrowings are classified as current liabilities unless the Group has an unconditional right todefer settlement of the liability for at least 12 months after the balance sheet date. |
| |
| | | | Trade and other payables |
| |
| | | | Trade and other payables are recognized initially at fair value and subsequently measured atamortized cost using the effective interest method. |
F-16
| | 2.10 | | Inventories |
| |
| | | | Inventories which include bullion on hand, gold in process and stores and materials, are measuredat the lower of cost and net realizable value after appropriate allowances for redundant and slowmoving items. Cost of bullion and gold in process is determined by reference to production cost,including amortization and depreciation at the relevant stage of production. |
| |
| | | | Stores and materials consist of consumable stores and are valued at weighted average cost. |
| |
| | | | Net realizable value is the estimated selling price in the ordinary course of business less theestimated cost of completion and the estimated cost necessary to perform the sale. |
| |
| | | | Gold-in-process inventories represent materials that are currently in the process of beingconverted to a saleable product. Conversion processes vary depending on the nature of the ore andthe specific mining operation, but include mill in-circuit, leach in-circuit, flotation and columncells, and carbon in-pulp inventories. In-process material is measured based on assays of thematerial fed to process and the projected recoveries at the respective plants. In-processinventories are valued at the average cost of the material fed to process attributable to thesource material coming from the mine, stockpile or leach pad plus the in-process conversion costs,including the applicable depreciation relating to the process facility, incurred to that point inthe process. Bullion on hand and gold in process at certain of the underground operations includegold in lockup which can be reliably measured, and generally this is from the smelter onwards.Where mechanized mining is used in underground operations, in-progress material is accounted for atthe earliest stage of production when reliable estimates of quantities and costs are capable ofbeing made, normally from when ore is broken underground. Given the varying nature of the Group’sopen pit operations, gold in process represents either production in broken ore form or productionfrom the time of placement on heap leach pads. |
| |
| | 2.11 | | Non-current assets or disposal group held for sale |
| |
| | | | A non-current asset or disposal group (a business grouping of assets and their related liabilities)is designated as held for sale when its carrying amount will be recovered principally through asale transaction rather that through continuing use. The classification as held for sale of anon-current asset or disposal group occurs when it is available for immediate sale in its presentcondition and the sale is highly probable. A sale is considered highly probable if management iscommitted to a plan to sell the non-current asset or disposal group, an active divestitureprogramme has been initiated, the non-current assets or disposal group is marketed at a pricereasonable to its fair value and the disposal will be completed within one year fromclassification. |
| |
| | | | Upon classification of a non-current asset or disposal group as held for sale, it is reviewed forimpairment. The impairment charged to the income statement is the excess of the carrying value ofthe non-current asset or disposal group over its expected net selling price (fair value less coststo sell). At each subsequent reporting date, the carrying values are remeasured for possibleimpairment. A gain is recognized for any subsequent increase in net selling price but not inexcess of the cumulative impairment loss already recognized. |
| |
| | | | No depreciation is provided on non-current assets from the date they are classified as held forsale. |
| |
| | | | When a disposal group is classified as held for sale it is also necessary to assess whether or notthe criteria for discontinued operations are met. If the criteria are met, the results of thedisposal group are classified as discontinued operations in the income statement and thecomparative amounts restated for all periods presented. |
| |
| | | | If a non-current asset or disposal group is classified as held for sale but the criteria forclassification as held for sale are no longer met, the disclosure of such non-current asset ordisposal group as held for sale is ceased. |
| |
| | | | On ceasing such classification, the non-current assets are reflected at the lower of: |
| | • | | the carrying amount before classification as held for sale adjusted for any depreciation oramortization that would have been recognized had the assets not been classified as held for sale;or |
| |
| | • | | the recoverable amount at the date the classification as held for sale ceases. The recoverableamount is the amount at which the asset would have been recognized after the allocation of anyimpairment loss arising on the cash generating unit as determined in accordance with the group’spolicy on impairment of non-financial assets. |
| | | | Any adjustment required to be made on reclassification is charged to the income statement onreclassification, and included in income from continuing operations. |
| |
| | | | Where the disposal group was also classified as a discontinued operations, the subsequentclassification as held for sale and used also requires that the discontinued operation be includedin continuing operations. Comparative information in the income statement relating to theclassification as a discontinued operation is restated accordingly. |
| |
| | 2.12 | | Environmental obligations |
| |
| | | | Estimated long term environmental obligations, comprising pollution control, rehabilitation andmine closure, are based on the Group’s environmental management plans in compliance with currenttechnological, environmental and regulatory requirements. |
F-17
| | | | Based on damage done to date, the net present value of expected rehabilitation cost estimates arerecognized and provided for in full in the financial statements. The estimates are reviewedannually and are discounted using a pre-tax risk-free rate that is adjusted to reflect the currentmarket assessments of the time value of money and the risks specific to the obligation. |
| |
| | | | Annual changes in the provision consist of finance costs relating to the change in the presentvalue of the provision and inflationary increases in the provision estimate, as well as changes inestimates. The present value of environmental disturbances created are capitalized to mining assetsagainst an increase in the rehabilitation provision. Rehabilitation projects undertaken, includedin the estimates are charged to the provision as incurred. The cost of ongoing current programmesto prevent and control pollution is charged against income as incurred. Over time, the liability isincreased to reflect an interest element, and the capitalized cost is depreciated over the life ofthe related asset. |
| |
| | 2.13 | | Environmental trust funds |
| |
| | | | Annual contributions are made to the Group’s trust funds, created in accordance with statutoryrequirements, to fund the estimated cost of pollution control, rehabilitation and mine closure atthe end of the life of the Group’s mines. Contributions are determined on the basis of theestimated environmental obligation over the life of the mine. The trusts are consolidated into theGroup. Income earned on monies paid to environmental trust funds is accounted for as investmentincome. The funds contributed to the trusts plus growth in the trust funds are included underrestricted investments on the balance sheet. |
| |
| | 2.14 | | Provisions |
| |
| | | | Provisions are recognized when the Group has a present legal or constructive obligation as a resultof past events where it is probable that an outflow of resources embodying economic benefits willbe required to settle the obligation, and a reliable estimate of the amount of the obligation canbe made. |
| |
| | | | The amount recognized as a provision is the present value of the best estimate of the expenditurerequired to settle the present obligation at balance sheet date. This estimate takes into accountthe associated risks and uncertainties. The increase in the provision due to the passage of timeis recognized as interest expense. |
| |
| | | | Provisions are reviewed at each balance sheet date and adjusted to reflect the current bestestimate. If it is no longer probable that an outflow of economic benefits will be required, theprovision is reversed. |
| |
| | 2.15 | | Current and deferred taxation |
| |
| | | | The current income tax charge is calculated on the basis of the tax laws enacted or substantivelyenacted at the balance sheet date in the countries where the Group operates and generates taxableincome. Management periodically evaluates positions taken in tax returns with respect to situationsin which applicable tax regulations is subject to interpretation and establishes provisions whereappropriate on the basis of amounts expected to be paid to the tax authorities. |
| |
| | | | The Group follows the comprehensive liability method of accounting for deferred tax using thebalance sheet approach. Under this method deferred income taxes are recognized for the taxconsequences of temporary differences by applying expected tax rates to the differences between thetax base of all assets or liabilities and its balance sheet carrying amount. Deferred tax ischarged to the income statement, except to the extent that deferred tax arises from the initialrecognition of an asset or liability in a transaction that is not a business combination and doesnot affect the accounting or taxable profit or loss at the time of the transaction. The effect ondeferred tax of any changes in tax rates is recognized in the income statement, except to theextent that it relates to items previously charged or credited directly to equity. |
| |
| | | | The principal temporary differences arise from amortization and depreciation on property, plant andequipment, provisions, post retirement benefits, tax losses and unutilized capital allowancescarried forward. Deferred tax assets relating to the carry forward of unutilized tax losses andunutilized capital allowances are recognized to the extent that it is probable that future taxableprofit will be available against which the unused tax losses and unutilized capital allowances canbe utilized. |
| |
| | | | Deferred income tax is provided on temporary differences arising on investments in subsidiaries andassociates, except where the timing of the reversal of the temporary difference is controlled bythe Group and it is probable that the temporary difference will not reverse in the foreseeablefuture. |
| |
| | 2.16 | | Employee benefits |
| | (i) | | Pension and provident plans are funded through annual contributions. The Group’s contributionsto the defined contribution pension and provident plans are charged to the income statement in theyear to which they relate. The Group’s liability is limited to its annually determinedcontributions. |
| |
| | (ii) | | Medical plans: The Group provides medical cover to current employees and certainretirees through certain funds. The medical accounting costs for the defined benefit plan areassessed using the projected unit credit method. The health care obligation is measured as thepresent value of the estimated future cash outflows using market yields consistent with the termand risks of the obligation. Actuarial gains and losses as a result of these valuations arerecognized in the income statement at revaluation date. The future liability for current andretired employees and their dependents is accrued in full based on actuarial valuations obtainedannually. |
F-18
| | (iii) | | Equity compensation benefits: The Group operates anequity-settled, share-based payments plan, where the Group grants share options to certainemployees. Equity share-based payments are measured at fair value of the equity instruments at thedate of the grant. The share-based payments is expensed over the vesting period, based on theGroup’s estimate of the shares that are expected to eventually vest. The Group used an appropriateoption pricing model in determining the fair value of the options granted. Non-market vestingconditions are included in assumptions about the number of options that are expected to vest. Ateach balance sheet date, the estimates of the number of options that are expected to becomeexercisable are revised. The impact of the revision of original estimates, if any, are recognizedin the income statement, with a corresponding adjustment to equity. The proceeds received net ofany directly attributable transaction costs are credited to share capital (nominal value) and sharepremium when the options are exercised. |
| |
| | (iv) | | Termination benefits are payable when employment is terminated before the normal retirementdate, or whenever an employee accepts voluntary redundancy in exchange for these benefits. TheGroup recognizes termination benefits when it is demonstrably committed to either: terminating theemployment of current employees according to a detailed formal plan without possibility ofwithdrawal; or providing termination benefits as a result of an offer made to encourage voluntaryredundancy. Benefits falling due more than 12 months after balance sheet date are discounted topresent value. |
| |
| | (v) | | Leave pay: The Group accrues for the cost of the leave days granted to employees during theperiod in which the leave days accumulate. |
| | 2.17 | | Share capital |
| |
| | | | Ordinary shares are classified as equity. Incremental costs directly attributable to the issue ofnew shares or options are shown in equity as a deduction, net of tax, from the proceeds. |
| |
| | 2.18 | | Leases |
| |
| | | | Leases in which a significant portion of the risk and rewards of ownership are retained by thelessor are classified as operating leases. Payments made under operating leases (net of anyincentives received from the lessor) are charged to the income statement on a straight-line basisover the period of the lease. |
| |
| | | | For the Group’s policy on finance leases, refer to note 2.5 (v). |
| |
| | 2.19 | | Revenue recognition |
| | (i) | | Revenue arising from gold sales is recognized when the price is determinable, the product hasbeen delivered in accordance with the terms of the contract, the significant risks and rewards ofownership have been transferred to the customer and collection of the sales price is reasonablyassured. These criteria are typically met when the gold arrives at the refinery. |
| |
| | | | Revenue further excludes value-added tax but includes the net realized profit and losses arisingfrom hedging transactions from matched gold sales contracts. Revenues from silver and otherby-products sales are credited to production costs as a by-product credit. |
| |
| | (ii) | | Interest income: Interest is recognized on a time proportion basis, taking into account theprincipal outstanding and the effective rate over the period to maturity, when it is determinedthat such income will accrue to the Group. |
| |
| | (iii) | | Dividend income is recognized when the shareholder’s right to receive payment is established.This is recognized at the last date of registration. |
| | 2.20 | | Dividends declared |
| |
| | | | Dividends declared are recognized in the period in which they are approved by the shareholders.Dividends are payable in South African Rand. |
| |
| | | | Dividends declared which are payable to foreign shareholders are subject to approval by the SouthAfrican Reserve Bank in terms of South African foreign exchange control regulations. In practice,dividends are freely transferable to foreign shareholders. |
| 3 | | Critical accounting estimates and judgments |
| |
| | | The preparation of the financial statements in conformity with IFRS requires the Group’s managementto make estimates and assumptions that affect the reported amounts of assets and liabilities anddisclosure of contingent assets and liabilities at the date of the financial statements, and thereported amounts of revenues and expenses during the reporting period. Actual results could differfrom those estimates. |
| |
| | | Estimates and judgments are continually evaluated and are based on historical experience and otherfactors, including expectations of future events that are believed to be reasonable under thecircumstances. |
F-19
| | | The resulting accounting estimates may differ from actual results. The estimates and assumptionsthat have a significant risk of causing a material adjustment to the carrying amounts of assets andliabilities within the next financial year are discussed below: |
| | 3.1 | | Impairment of mining assets |
| |
| | | | The recoverable amount of mining assets is generally determined utilizing discounted future cashflows. Management also considers such factors as the quality of the individual ore body and countryrisk in determining the fair value. |
| |
| | | | Key assumptions for the calculations of the mining assets’ recoverable amounts are the forward goldprice and the annual life of mine plans. In determining the gold price to be used, managementassess the long term views of several reputable institutions on the gold price and based on this,derive the forward gold price. The life of mine plans are based on the proven and probable reservesas included in the Reserve Declaration, which are determined in terms of SAMREC and JORC. |
| |
| | | | During the year under review, the Group calculated the recoverable amounts (generally fair valueless costs to sell) based on updated life of mine plans, a gold price of R180 000 per kilogram anda discount rate of 11.36% (2007: R115 000 per kilogram and a 9.18% discount rate) (2006: R105 000per kilogram and a 8.38% discount rate). Cash flows used in the impairment calculations are basedon life of mine plans which exceed five years for the majority of the mines. Refer to note 5 fordetails of impairments recorded. |
| |
| | | | Should management’s estimate of the future not reflect actual events, further impairments may beidentified. Factors affecting the estimates include: |
| | • | | changes to proven and probable ore reserves; |
| |
| | • | | the grade of the ore reserves may vary significantly from time to time; |
| |
| | • | | review of strategy; |
| |
| | • | | differences between actual commodity prices and commodity price assumptions; |
| |
| | • | | unforeseen operational issues at the mines; |
| |
| | • | | changes in capital, operating mining, processing and reclamation costs. |
| | | | It is impracticable to disclose the extent of the possible effects the changes in assumptions forthe forward gold price and life of mine plans at June 30, 2008, as these assumptions areinextricably linked. |
| |
| | 3.2 | | Impairment of investment in associate |
| |
| | | | The investments in associates are evaluated for impairment by comparing the entire carrying valueof the investment to the recoverable amount, which is the higher of value in use or fair value lesscosts to sell. In calculating fair value less cost to sell, the cash flows from disposal are lookedat: with reference to the closing share price on year end, average share price over a reasonableperiod thereafter as well as recent transactions. |
| |
| | 3.3 | | Valuation of available for sale financial assets |
| |
| | | | If the value of financial instruments cannot be obtained from an active market, the Groupestablishes fair value by using valuation techniques. These include the use of recent arm’s lengthtransactions, reference to other instruments that are substantially the same, discounted cash flowanalysis and option pricing models refined to reflect the issuer’s specific circumstances. |
| |
| | 3.4 | | Estimate of exposure and liabilities with regard to rehabilitation costs |
| |
| | | | Estimated long term environmental obligations, comprising pollution control, rehabilitation andmine closure, are based on the Group’s environmental management plans in compliance with currenttechnological, environmental and regulatory requirements. |
| |
| | | | Management used a short term (two years) inflation rate of 9%, a long term inflation rate of 6%(2007: 5%) (2006: 5.5%) and the expected life of the mines according to the life-of-mine plans inthe calculation of the estimated net present value of the rehabilitation liability. The discountrates used for the calculation are dependant on the shaft’s life of mine and are as follows: for 12months — 12.25% (2007: 13.77%); for 1 — 5 years — 11.75% (2007:10.61%); for 5 — 9 years — 10.5%(2007: 9.49%) and for 10 years or more — 10.25% (2007: 9.25%) (2006: discount rate of 12.88%).These estimates were based on recent yields determined on government bonds. |
| |
| | 3.5 | | Estimate of employee benefit liabilities |
| |
| | | | An updated actuarial valuation is carried out at the end of each financial year. Assumptions usedto determine the liability included a discount rate of 12%, no increases in employer subsidies (interms of the agreement) and mortality rates according to the SA 1956/62 mortality table ( SA “a mf”tables) (60 years) and a medical inflation rate of 9.8% (2006 and 2007: discount rate of 9%, 60years and 6.34% inflation rate). |
| |
| | | | Management determined the discount rate by assessing financial instruments with similar terms tothe liability. The increases to the discount rate and medical inflation rate are similar to changesin interest and inflation rates in South Africa. |
| |
| | 3.6 | | Estimate of taxation |
| |
| | | | The Group is subject to income tax in numerous jurisdictions. Significant judgment is required indetermining the worldwide provision for income taxes. There are many transactions and calculationsfor which the ultimate tax determination is uncertain during the ordinary course of business. TheGroup recognizes liabilities for anticipated tax audit issues based on estimates of |
F-20
| | | | whetheradditional taxes will be due. Where the final tax outcome of these matters is different from theamounts that were initially recorded, such differences will impact the income tax and deferred taxprovisions in the period in which such determination is made. |
| | | | Management has to exercise judgment with regards to deferred tax assets. Where the possibilityexists that no future taxable income may flow against which these assets can be offset, thedeferred tax assets are not raised. |
| |
| | 3.7 | | Fair value of share-based payments |
| |
| | | | The fair value of options granted are being determined using either a binominal or a Monte Carlovaluation model. The significant inputs into the model are: vesting period and conditions, riskfree interest rate, volatility, price on date of grant and dividend yield. (Refer to note 35 fordetail on each of the share option schemes.) |
| |
| | 3.8 | | Impairment of goodwill |
| |
| | | | The Group tests annually whether separately identifiable goodwill has suffered any impairment, inaccordance with the accounting policy stated in note 2.8. Refer to note 17 for the method used indetermining the recoverable amounts of cash-generating units. These calculations require the use ofestimates as stated in note 3.1. |
| |
| | 3.9 | | Gold in lock-up |
| |
| | | | Gold in lock-up in certain plants is estimated based on the calculated plant call factor. Plantcall factor is the efficiency measurement of the percentage of gold extracted from the ore. |
| |
| | 3.10 | | Assessment of contingencies |
| |
| | | | Contingencies will only realize when one or more future events occur or fail to occur. The exerciseof significant judgment and estimates of the outcome of future events are required during theassessment of the impact of such contingencies. |
| |
| | 3.11 | | Gold mineral reserves |
| |
| | | | Gold mineral reserves are estimates of the amount of ounces that can be economically and legallyextracted from the Group’s properties. In order to calculate the gold mineral reserves, estimatesand assumptions are required about a range of geological, technical and economic factors, includingquantities, grades, production techniques, recovery rates, production costs, commodity prices andexchange rates. |
| |
| | | | Estimating the quantities and/or grade of the reserves requires the size, shape and depth of theore bodies to be determined by analyzing geological data such as the logging and assaying of drillsamples. This process may require complex and difficult geological judgments and calculations tointerpret the data. |
| |
| | | | Because the economic assumptions used to estimate the gold mineral reserves change from year toyear, and because additional geological data is generated during the course of operations,estimates of the mineral reserves may change from year to year. Changes in the proven and probablereserves may affect the Group’s financial results and financial position in a number of ways,including; |
| | • | | asset carrying values may be affected due to changes in estimated cash flows; |
| |
| | • | | depreciation and amortization charged in the income statement may change as they are calculated on the units-of-production method; |
| |
| | • | | environmental provisions may change as the timing and/or cost of these activities may be affectedby the change in mineral reserves. |
| | | | At the end of each financial year, the estimate of proven and probable gold mineral reserve isupdated. Depreciation of mining assets is prospectively adjusted, based on these changes. |
| |
| | 3.12 | | Production start date |
| |
| | | | Various relevant criteria are considered in order to assess when the mine is substantially completeand ready for its intended use and moves into the production phase. Some of the criteria wouldinclude but are not limited to the following: |
| | • | | the level of capital expenditure compared to the total project cost estimates; |
| |
| | • | | the ability to produce gold in a saleable form (where more than an insignificant amount of gold has been produced); |
| |
| | • | | the ability to sustain the ongoing production of gold. |
| 4 | | Financial risk management |
| | | | The Group’s activities expose it to a variety of financial risks: market risk (including currencyrisk, fair value interest rate risk, cash flow interest rate risk and other price risk), creditrisk and liquidity risk. The Group may use derivative financial instruments to hedge certain riskexposures. |
| |
| | | | Risk management is carried out by a central treasury department (“Group Treasury”) under policiesapproved by the Board of Directors. Group Treasury identifies, evaluates and hedges financial risksin close co-operation with the Group’s operating units. The Board provides written principles foroverall risk management, as well as written policies covering specific areas, such as |
F-21
| | | | foreign exchange risk, interest rate risk, credit risk, use of derivative financial instruments andnon-derivative financial instruments, and the investment of excess liquidity. |
| | (a) | | Market risk |
| |
| | | | (i) Foreign exchange risk |
| |
| | | | The Group operates internationally and is exposed to foreign exchange risk arising from variouscurrency exposures, primarily with respect to the US dollar (US$). Foreign exchange risk arisesfrom future commercial transactions, recognized assets and liabilities and net investments inforeign operations. Foreign exchange risk arises when future commercial transactions or recognizedassets or liabilities are denominated in a currency that is not the entity’s functional currency.Harmony’s revenues are sensitive to the Rand/US$ exchange rate as all revenues are generated bygold sales denominated in US$. Harmony generally, does not enter into forward sales, derivatives orother hedging arrangements to establish a Rand/US$ exchange rate in advance for the sale of itsfuture gold production. |
| |
| | | | The Group has certain investments in foreign operations, whose net assets are exposed to foreigncurrency translation risk. |
| |
| | | | Harmony generally does not enter into forward sales, derivatives orother hedging arrangements to manage this risk. |
| |
| | | | Sensitivity analysis |
| |
| | | | The Group has reviewed its foreign currency exposure on financial assets and financial liabilitiesand has identified the following sensitivities for a 10% change in the exchange rate. |
| | | | | | | | | |
| | | US Dollar | |
| Figures in million | | 2008 | | | 2007 | |
| | | | | | | | |
A$ against the US$ | | | | | | | | |
| | | | | | | | |
Increase by ten percent | | | 3 | | | | — | |
Decrease by ten percent | | | (3 | ) | | | — | |
| |
Closing rate | | | 0.96 | | | | 0.85 | |
| |
| | | | | | | | |
A$ against the Rand | | | | | | | | |
| | | | | | | | |
Increase by ten percent | | | 30 | | | | 14 | |
Decrease by ten percent | | | (30 | ) | | | (14 | ) |
| |
Closing rate | | | 7.51 | | | | 6.00 | |
| |
| | | | | | | | |
Kina against the A$ | | | | | | | | |
| | | | | | | | |
Increase by ten percent | | | 35 | | | | 12 | |
Decrease by ten percent | | | (35 | ) | | | (12 | ) |
| |
Closing rate | | | 2.42 | | | | 2.43 | |
| |
| | | | (ii) Other price risk |
| |
| | | | The Group is exposed to the risk of fluctuations in the fair value of the available-for-salefinancial assets as a result of changes in market prices (other than changes in interest rates andforeign currencies). Harmony generally does not use any derivative instruments to manage this risk. |
| |
| | | | Sensitivity analysis |
| |
| | | | The equity investments are listed on the Australian Securities Exchange. A one percent increase inthe share price at the reporting date, with all other variables held constant, would have increasedother comprehensive income by US$0.1 million (2007: US$3.5 million); an equal change in theopposite direction would have decreased other comprehensive income by US$0.1 million (2007: US$3.5million). The analysis is performed on the same basis for 2007. |
| |
| | | | Commodity price sensitivity |
| |
| | | | The profitability of the Group’s operations, and the cash flows generated by those operations, areaffected by changes in the market price of gold. Harmony generally does not enter into forwardsales, derivatives or other hedging arrangements to establish a price in advance for the sale offuture gold production. |
| |
| | | | (iii) Cash flow and fair value interest rate risk |
| |
| | | | The Group’s interest rate risk arises mainly from long-term borrowings. The Group has both fixedand variable interest rate borrowings. Fixed rate borrowings expose the Group to fair valueinterest rate risk. Variable rate borrowings expose the Group to cash flow interest rate risk. TheGroup has not entered into interest rate swap agreements. |
F-22
| | | | Sensitivity analysis |
| |
| | | | A change of 100 basis points in interest rates at the reporting date would have increased(decreased) profit or loss before tax by the amounts shown below. This analysis assumes that allother variables remain constant. The analysis is performed on the same basis for 2007. |
| | | | | | | | | |
| | | US Dollar | |
| Figures in million | | 2008 | | | 2007 | |
Increase in 100 basis points | | | 3 | | | | 16 | |
Decrease in 100 basis points | | | (3 | ) | | | (16 | ) |
| |
| | | | The above table excludes the fixed rate convertible bond. As it is accounted for at amortized cost,interest rate changes do not affect reported profit and loss. |
| |
| | (b) | | Credit risk |
| |
| | | | Credit risk is the risk that a counterparty may default or not meet its obligations timeously.Financial instruments, which subject the Group to concentrations of credit risk, consistpredominantly of restricted cash, restricted investments, trade and other receivables (excludingnon-financial instruments) and cash and cash equivalents. |
| |
| | | | Exposure to credit risk on trade and other receivables is monitored on a regular basis. The creditrisk arising from restricted cash, cash and cash equivalents and restricted investments is managedby ensuring amounts are only invested with financial institutions of good credit quality. The Grouphas policies that limit the amount of credit exposure to any one financial institution. |
| |
| | | | It is the policy of the Group to renegotiate credit terms with long-standing customers who have agood credit history with the Group. These customers are monitored on an ongoing basis to ensurethat the customer remains within the renegotiated terms. |
| |
| | | | The Group’s maximum exposure to credit risk is represented by the carrying amount of all financialassets determined to be exposed to credit risk, amounting to US$361.2 million as at June 30, 2008(2007: US$409.4 million). |
| |
| | (c) | | Liquidity Risk |
| |
| | | | Prudent liquidity risk management implies maintaining sufficient cash and marketable securities,the availability of funding through an adequate amount of committed credit facilities and theability to close out market positions. Due to the dynamic nature of the underlying businesses,Group Treasury aims to maintain flexibility in funding by keeping committed credit lines available. |
| |
| | | | In the ordinary course of business, the Group receives cash from its operations and is required tofund working capital and capital expenditure requirements. The cash is managed to ensure thatsurplus funds are invested in a manner to achieve market-related returns and to provide sufficientliquidity at the minimum risk. The Group is able to actively source financing at competitive rates. |
F-23
| | | | The following are the contractual maturities of financial liabilities (including principal andinterest payments): |
| | | | | | | | | |
| | | | | | | More than 1 | |
| | | Current | | | year | |
| Figures in million | | US Dollar | |
| | | | | | | | |
2008 | | | | | | | | |
Borrowings (1)(2) | | | 518 | | | | 29 | |
Trade and other payables (excluding non-financial instruments) | | | 101 | | | | — | |
| |
| | | 619 | | | | 29 | |
| |
| | | | | | | | |
2007 | | | | | | | | |
Borrowings (1)(2) | | | 422 | | | | 277 | |
Trade and other payables (excluding non-financial instruments) | | | 114 | | | | — | |
Bank overdraft | | | 31 | | | | — | |
| |
| | | 567 | | | | 277 | |
| |
| | | |
| (1) | | US$226.8 million is due between 6 to 12 months (2007: US$5.8 million) |
| |
| (2) | | US$7.4 million is due between 1 to 2 years (2007: US$277.4 million) |
| | (d) | | Capital risk management |
| |
| | | | The primary objective of managing the Group’s capital is to ensure that there is sufficient capitalavailable to support the funding requirements of the Group, in a way that optimizes the cost ofcapital and matches the current strategic business plan. |
| |
| | | | The Group manages and makes adjustments to the capital structure, which consists of debt(borrowings and bank overdraft) and equity, as and when borrowings mature or when funding isrequired. This may take the form of raising equity, market or bank debt or hybrids thereof. TheGroup may also adjust the amount of dividends paid, sell assets to reduce debt or schedule projectsto manage the capital structure. |
| |
| | | | There were no changes to the Group’s approach to capital management during the year. |
| |
| | | | The Group is subject to externally imposed capital requirements in the form of loan covenantsrelating to interest cover, which may have an impact on the manner in which capital is utilized.The Group has complied with these capital requirements during the periods under review. |
| |
| | (e) | | Fair value determination |
| |
| | | | The carrying values (less any impairment allowance) of short-term financial instruments are assumedto approximate their fair values. |
| |
| | | | The fair value of available-for-sale financial assets and derivative financial instruments aredetermined by reference to quoted market prices. The fair value of other non-current financialinstruments are determined using a discounted cash flow model with market observable inputs, suchas market interest rates. |
F-24
Comparison between carrying value and fair value of financial assets and liabilities:
| | | | | | | | | |
| | | | | | | Carrying | |
| | | Fair Value | | | Value | |
| |
| Figures in million | | US Dollar | |
| |
| | | | | | | | |
2008 | | | | | | | | |
Financial assets | | | | | | | | |
Restricted investments | | | 211 | | | | 211 | |
Investment in financial assets | | | 9 | | | | 9 | |
Trade and other receivables | | | 87 | | | | 87 | |
Restricted cash | | | 10 | | | | 10 | |
Cash and cash equivalents | | | 53 | | | | 53 | |
| |
| | | 370 | | | | 370 | |
| |
| | | | | | | | |
Financial liabilities | | | | | | | | |
Borrowings * | | | 526 | | | | 526 | |
Trade and other payables | | | 94 | | | | 94 | |
| |
| | | 620 | | | | 620 | |
| |
| | | | | | | | |
2007 | | | | | | | | |
Financial assets | | | | | | | | |
Restricted investments | | | 195 | | | | 195 | |
Investment in financial assets | | | 8 | | | | 8 | |
Trade and other receivables | | | 65 | | | | 65 | |
Restricted cash | | | 41 | | | | 41 | |
Cash and cash equivalents | | | 101 | | | | 101 | |
| |
| | | 410 | | | | 410 | |
| |
| | | | | | | | |
Financial liabilities | | | | | | | | |
Borrowings | | | 682 | | | | 653 | |
Trade and other payables | | | 96 | | | | 96 | |
Bank overdraft | | | 31 | | | | 31 | |
| |
| | | 809 | | | | 780 | |
| |
| | | |
| * | | Included under borrowings is an uncollateralized convertible fixed rate bond which has a fairvalue of US$209.2 million (US$247.2 million) being 96% of the nominal value as at June 30, 2008(2007: 102.36% of the nominal value). |
F-25
| | | | | | | | | | | | | |
| | | US Dollar | |
| |
| Figures in million | | 2008 | | | 2007 | | | 2006 | |
| |
| | | | | | | | | | | | |
Production costs (a) | | | 918 | | | | 836 | | | | 778 | |
Amortization and depreciation of mining properties, mine development costsand mine plant facilities | | | 107 | | | | 102 | | | | 129 | |
Amortization and depreciation of assets other than mining properties, minedevelopment costs and mine plant facilities (b) | | | 10 | | | | 4 | | | | 9 | |
Provision/(reversal of provision) for rehabilitation costs (c) | | | 1 | | | | (6 | ) | | | (3 | ) |
Care and maintenance cost of restructured shafts | | | 10 | | | | 8 | | | | 22 | |
Employment termination and restructuring costs (d) | | | 29 | | | | — | | | | (12 | ) |
Share-based payments | | | 6 | | | | 6 | | | | 15 | |
Impairment/(reversal of impairment) of assets (e) | | | 40 | | | | (19 | ) | | | (30 | ) |
Provision for former employees’ post retirement benefits | | | 1 | | | | (2 | ) | | | 1 | |
| |
Total cost of sales | | | 1,122 | | | | 929 | | | | 909 | |
| |
| | | |
| (a) | | Production costs include mine production, transport and refinery costs, applicable general and administrativecosts, movement in inventories and ore stockpiles and ongoing environmental rehabilitation costs as well astransfers to and from deferred stripping. Ongoing employee termination costs are included, however employeetermination costs associated with major restructuring and shaft closures are excluded. Production costs,analyzed by nature, consist of the following: |
| | | | | | | | | | | | | |
| | | US Dollar | |
| |
| Figures in million | | 2008 | | | 2007 | | | 2006 | |
| |
| | | | | | | | | | | | |
Labor costs, including contractors | | | 632 | | | | 612 | | | | 561 | |
Stores and materials | | | 229 | | | | 196 | | | | 184 | |
Water and electricity | | | 90 | | | | 91 | | | | 95 | |
Hospital costs | | | 10 | | | | 4 | | | | 11 | |
Changes in inventory | | | 11 | | | | (10 | ) | | | (16 | ) |
Capitalization of mine development costs | | | (109 | ) | | | (64 | ) | | | (84 | ) |
By-products sales | | | (4 | ) | | | (3 | ) | | | (1 | ) |
Other | | | 59 | | | | 10 | | | | 28 | |
| |
Total production cost | | | 918 | | | | 836 | | | | 778 | |
| |
| | | |
| (b) | | Amortization and depreciation of assets other than mining properties, mine development costs and mine plant facilities consist of thefollowing: |
| | | | | | | | | | | | | |
| | | US Dollar | |
| |
| Figures in million | | 2008 | | | 2007 | | | 2006 | |
| |
| | | | | | | | | | | | |
Other non-mining assets | | | 4 | | | | 2 | | | | 7 | |
Intangible assets | | | 2 | | | | 1 | | | | — | |
Borrowings’ issue costs | | | 4 | | | | 1 | | | | 2 | |
| |
Total amortization and depreciation | | | 10 | | | | 4 | | | | 9 | |
| |
| | |
| (c) | | For the assumptions used to calculate the rehabilitation costs, refer to note 3.4. |
| |
| (d) | | Employment termination and restructuring costs consist of the following: |
| | | | | | | | | | | | | |
| | | US Dollar | |
| |
| Figures in million | | 2008 | | | 2007 | | | 2006 | |
| |
| | | | | | | | | | | | |
Free State | | | 10 | | | | — | | | | (9 | ) |
Randfontein and Elandskraal | | | 5 | | | | — | | | | 1 | |
Evander | | | 3 | | | | — | | | | 1 | |
Freegold | | | 10 | | | | — | | | | (5 | ) |
Avgold | | | 1 | | | | — | | | | — | |
| |
Total employment termination and restructuring cost | | | 29 | | | | — | | | | (12 | ) |
| |
During the December 2007 quarter, a voluntary retrenchment process wasbegun, following the Group’s decision to decentralize centralservices, as well as the restructuring of shafts due to the cessationof CONOPS. This process was completed at year-end.
F-26
During the 2006 financial year, the Group continued with the processof down-scaling production at some shafts. This was done according tothe initial plan, that was communicated to the unions by June 30,2005, initiated following the weakening of the gold price in rand perkilogram terms. Actual cost amounted to US$22 million and was utilizedagainst the provision recognized in 2005 financial year. The remainingbalances were reversed during 2006 financial year.
| (e) | | Impairment/(reversal of impairment) consist of the following: |
| | | | | | | | | | | | | |
| | | US Dollar | |
| |
| Figures in million | | 2008 | | | 2007 | | | 2006 | |
| |
| | | | | | | | | | | | |
Free State | | | — | | | | 2 | | | | (22 | ) |
Lydex | | | — | | | | — | | | | 16 | |
Evander | | | 16 | | | | — | | | | (11 | ) |
Kalgold | | | 8 | | | | (19 | ) | | | — | |
Bambanani | | | — | | | | — | | | | (7 | ) |
Other underground — assets | | | 3 | | | | (2 | ) | | | (6 | ) |
Other underground — goodwill | | | 13 | | | | — | | | | — | |
| |
Total impairment/(reversal of impairment) | | | 40 | | | | (19 | ) | | | (30 | ) |
| |
During the 2008 year, impairments were recognized at severalof the Group’s operations, which resulted primarily from changesto the life of mine plans. Goodwill relating to certain undergroundoperations was also impaired. For further details on the allocationof goodwill, refer to note 17. For assumptions used to calculate therecoverable amount, refer to note 3.1.
During the year ended June 30, 2007, the Group recorded an impairmentat the Free State operations relating to the cessation of operations at the Refinery. TheGroup also reversed impairments previously recorded at its surface operations(Kalgold) and other underground operations, where the recoverable amounts calculatedusing fair value less costs to sell exceeded the carrying values.
During the year ended June 30, 2006, the Group reversed US$46.0 million of theUS$110.3 million impairment recorded in 2005 at its Free State, Evander, Bambananiand other underground operations. The recoverable amounts fairly exceeded the carryingvalue of the above mentioned operations at June 30, 2006. Accordingly a decision was madeto reverse the previously recorded impairments.
The US$15.9 million impairment recorded in 2006 at Lydenburg Explorations Limited relatesto an impairment loss on amounts previously capitalized as undeveloped properties forwhich no future financial benefits are expected by management.
| 6 | | Other (expenses)/income — net |
| | | | | | | | | | | | | |
| | | US Dollar | |
| |
| Figures in million | | 2008 | | | 2007 | | | 2006 | |
| |
| | | | | | | | | | | | |
Foreign exchange gains/(losses) — net (a) | | | 13 | | | | 2 | | | | (4 | ) |
(Loss)/gain on financial instruments (b) | | | (1 | ) | | | 6 | | | | (81 | ) |
Profit on sale of property, plant and equipment (c) | | | — | | | | 25 | | | | 10 | |
Non-mining bad debts (d) | | | (14 | ) | | | (1 | ) | | | (1 | ) |
Other expenses — net | | | (13 | ) | | | (7 | ) | | | (21 | ) |
| |
Total other (expenses)/income — net | | | (15 | ) | | | 25 | | | | (97 | ) |
| |
| | | |
| (a) | | Included in 2008 is a US$15.3 million foreign exchange gain related tothe two loans to the International operations. The loans, which were previously designated asnet investments of the Group’s International operations, were de-designated in 2008, mainly as a resultof the expected proceeds from the PNG Partnership Agreement (see note 39). Foreign exchange gains/(losses) arising afterde-designation of the loans have been included in the consolidated income statements. Accumulated foreign exchangegains/(losses) that arose while the loans were considered to form part of the Group’s netinvestment in its International operations, will bereclassified to the consolidated income statements as and when the loans are repaid. |
| |
| (b) | | The amounts in prior years mainly relate to the Australian hedge book which was closed in 2007. |
| |
| (c) | | The Randfontein 4 Shaft was sold to Ezulwini Mining Company (Pty) Ltd on December 29, 2006, resulting in a profit of US$9.8 million. |
| |
| | | The Deelkraal surface assets were disposed of at a profit of US$13.7 million to Ogoerion Construction CC on April 5, 2007. |
| |
| (d) | | The amount in 2008 includes a provision for the outstandingbalance of US$6.4 million on the sale of Deelkraal to OgoerionConstruction CC. |
F-27
| 7 | | Operating profit/(loss) |
The following have been included in operating profit/(loss):
| | | | | | | | | | | | | |
| | | US Dollar | |
| |
| Figures in million | | 2008 | | | 2007 | | | 2006 | |
| |
| | | | | | | | | | | | |
Auditors’ remuneration | | | 3 | | | | 2 | | | | 2 | |
| |
| 8 | | Profit on sale of investment in associate |
| | | | | | | | | | | | | |
| | | US Dollar | |
| |
| Figures in million | | 2008 | | | 2007 | | | 2006 | |
| |
| | | | | | | | | | | | |
Profit on the sale of Western Areas Limited | | | — | | | | 33 | | | | — | |
| |
On December 8, 2006, the Group disposed of its interest in Western Areas Limited (“WesternAreas”). Refer to note 20.
| 9 | | Fair value of non-derivative financial instruments |
| | | | | | | | | | | | | |
| | | US Dollar | |
| |
| Figures in million | | 2008 | | | 2007 | | | 2006 | |
| |
| | | | | | | | | | | | |
Mark-to-market adjustment | | | 5 | | | | 15 | | | | 14 | |
| |
The sale agreement of African Rainbow Minerals Limited(ARM) shares gave rise to a non-derivativefinancial instrument that is designated as at “fairvalue through profit and loss” and included in“Investment in financial assets” on the balancesheet. The fair value movement recognized isequivalent to the interest paid on the Nedbankloans. (Refer to note 19 (f) and 28 (d) and (e)).
| 10 | | Loss on sale of investment |
| | | | | | | | | | | | | |
| | | US Dollar | |
| |
| Figures in million | | 2008 | | | 2007 | | | 2006 | |
| |
| | | | | | | | | | | | |
(Loss)/profit on sale of investment in Gold Fields Limited | | | (63 | ) | | | (5 | ) | | | 45 | |
| |
In the 2006 financial year, the Group disposed of its remaining investment, purchased in November 2004, held in Gold Fields Limited (“Gold Fields”) forUS$346 million. The process was concluded through marketdisposals which commenced on November 10, 2005 and an open market offering on November 15 and 16, 2005. The investment was acquired at a cost of US$316.8 million, resulting in a profit of US$45 million.
On December 8, 2006, the Group received 15 745 079 ordinary shares in Gold Fields, issued at R135.02 (US$19.15) per share, in exchange for its interest in WesternAreas. Refer to note 20 on associates and note19 on investments in financial assets for further detail.
The Group disposed of 2 650 000 shares during 2007, and the remaining 7 348 079 shares in 2008, resulting in realized losses of US$5 million and US$63 million,respectively. For further detail, refer to note 19.
| | | | | | | | | | | | | |
| | | US Dollar | |
| |
| Figures in million | | 2008 | | | 2007 | | | 2006 | |
| |
| | | | | | | | | | | | |
Interest received | | | 34 | | | | 24 | | | | 29 | |
| |
Loans and receivables | | | 5 | | | | 1 | | | | 3 | |
Held-to-maturity investments | | | 18 | | | | 14 | | | | 9 | |
Cash and cash equivalents | | | 11 | | | | 9 | | | | 17 | |
| |
Dividend income on available-for-sale | | | 5 | | | | 3 | | | | 2 | |
| |
Total investment income | | | 39 | | | | 27 | | | | 31 | |
| |
F-28
| | | | | | | | | | | | | |
| | | US Dollar | |
| |
| Figures in million | | 2008 | | | 2007 | | | 2006 | |
| |
| | | | | | | | | | | | |
Financial instruments | | | | | | | | | | | | |
Bank and short-term facilities | | | 5 | | | | — | | | | — | |
Senioruncollateralized fixed rate bonds | | | — | | | | — | | | | 14 | |
Convertible uncollateralized fixed rate bonds | | | 22 | | | | 21 | | | | 23 | |
Nedbank Limited | | | 38 | | | | 18 | | | | 16 | |
Rand Merchant Bank | | | 2 | | | | 13 | | | | 4 | |
Other creditors | | | 1 | | | | 5 | | | | — | |
| |
| | | 68 | | | | 57 | | | | 57 | |
| |
| | | | | | | | | | | | |
Non-financial instruments | | | | | | | | | | | | |
Post-retirement benefits | | | 1 | | | | 1 | | | | 1 | |
Time value of money and inflation component of rehabilitation costs | | | 15 | | | | 15 | | | | 10 | |
South African Revenue Services (SARS) | | | 8 | | | | 2 | | | | — | |
| |
| | | 24 | | | | 18 | | | | 11 | |
| |
| | | 92 | | | | 75 | | | | 68 | |
Interest capitalized | | | (22 | ) | | | (10 | ) | | | (6 | ) |
| |
Total finance costs | | | 70 | | | | 65 | | | | 62 | |
| |
| | | | | | | | | | | | | |
| | | US Dollar | |
| |
| Figures in million | | 2008 | | | 2007 | | | 2006 | |
| |
| | | | | | | | | | | | |
| | | | | | | | | | | | |
SA normal taxation | | | | | | | | | | | | |
Mining tax (a) | | | | | | | | | | | | |
- current year | | | (5 | ) | | | — | | | | — | |
- prior year | | | (15 | ) | | | — | | | | — | |
Non-mining tax (b) | | | | | | | | | | | | |
- current year | | | (1 | ) | | | (2 | ) | | | (2 | ) |
| | | | | | | | | | | | |
- prior year | | | (1 | ) | | | 1 | | | | — | |
Deferred tax (c) | | | | | | | | | | | | |
- deferred tax | | | (55 | ) | | | (60 | ) | | | (31 | ) |
| | | | | | | | | | | | |
Foreign normal taxation | | | | | | | | | | | | |
| | | | | | | | | | | | |
- deferred tax (d) | | | 12 | | | | 22 | | | | 11 | |
Total normal taxation | | | (65 | ) | | | (39 | ) | | | (22 | ) |
| |
| | |
| (a) | | Mining tax on gold mining income in South Africa is determined accordingto a formula, based on the taxable income from mining operations. GoldMining Companies within the Group that have elected to be exempt fromSecondary Tax on Companies (“STC”) are taxed at higher rates than thosethat have not made the election. |
| |
| | | All qualifying mining capital expenditure is deducted from taxablemining income to the extent that it does not result in an assessed lossand accounting depreciation is eliminated when calculating the SouthAfrican mining tax income. Excess capital expenditure is carried forwardas unredeemed capital to be claimed from future mining taxableincome. The Group has several tax paying entities in South Africa. Interms of the mining ring-fencing application, each ring-fenced mine istreated separately and deductions can normally only be utilized againstmining income generated from the relevant ring-fenced mine. |
| |
| | | The formulas for determining the South African gold mining tax rates are: |
| |
| | | Y = 43 - 215/X (elect not to pay STC) |
| |
| | | Y = 45 - 225/X (elect not to pay STC for 2007 and 2006) |
| |
| | | Y = 34 - 170/X (no election made) |
| |
| | | Y = 35 - 175/X (no election made for 2007 and 2006) |
| |
| | | Where Y is the percentage rate of tax payable and X is the ratio oftaxable income, net of any qualifying capital expenditure that bears tomining income so derived, expressed as a percentage. |
F-29
| | |
| |
| (b) | | Non-mining income is taxed at 35% (exempt from STC) (2007: 37% and 2006:37%) and 28% (no election made) (2007: 29% and 2006: 29%). Non-miningcompanies are taxed at the statutory corporate rate of 28% (2007: 29%and 2006: 29%). |
| |
| (c) | | The tax rate used to calculate deferred tax is based on the currentestimate of future profitability when temporary differences will reversebased on tax rates (and tax laws) that have been enacted at balancesheet date. Depending on the profitability of the operations, the taxrate can consequently be significantly different from year to year. |
| |
| (d) | | Mining and non-mining income of Australia operations are taxed at astandard rate of 30% (2007: 30% and 2006: 30%). Deferred tax is providedat the estimated expected future mining tax rate for temporarydifferences, based on tax rates enacted at balance sheet date. |
| |
| | | The taxation rates in South African were changed in the 2008 year afteran announcement of a reduction in the applicable rates by the FinanceMinister in his annual budget speech in February 2008. |
| |
| | | Major items causing the Group’s income tax provision to differ from themaximum mining statutory tax rate of 43% (2007: 45% and 2006: 45%) were: |
| | | | | | | | | | | | | |
| | | US Dollar | | | | |
| |
| Figures in million | | 2008 | | | 2007 | | | 2006 | |
| |
| | | | | | | | | | | | |
Tax on net income at the maximum mining statutory tax rate | | | (33 | ) | | | (34 | ) | | | 28 | |
Non-taxable income / non-allowable deductions | | | (50 | ) | | | (12 | ) | | | (15 | ) |
Difference between effective mining tax rate and statutory mining rate on mining income | | | 4 | | | | — | | | | 6 | |
Difference between non-mining tax rate and statutory mining rate on non-mining income | | | — | | | | 1 | | | | (12 | ) |
Effect on temporary differences due to changes in effective tax rates | | | (8 | ) | | | 5 | | | | (29 | ) |
Prior year adjustment — mining and non-mining tax | | | (16 | ) | | | 1 | | | | — | |
Capital allowance and sale of business | | | 38 | | | | — | | | | — | |
| |
Income and mining taxation | | | (65 | ) | | | (39 | ) | | | (22 | ) |
| |
| |
Effective income and mining tax rate | | | 172 | % | | | -25 | % | | | 24 | % |
Deferred tax liabilities and assets on the balance sheet as of June 30, 2008 and June 30, 2007relate to the following:
| | | | | | | | | |
| | | US Dollar | |
| |
| Figures in million | | 2008 | | | 2007 | |
| |
| | | | | | | | |
Deferred tax liabilities | | | | | | | | |
Gross deferred tax liability | | | 579 | | | | 599 | |
| |
Amortization and depreciation | | | 540 | | | | 581 | |
Product inventory not taxed | | | 13 | | | | 14 | |
Convertible bonds | | | 1 | | | | 3 | |
Other | | | 25 | | | | 1 | |
| |
Gross deferred tax assets | | | (190 | ) | | | (216 | ) |
| |
Deferred financial liability | | | — | | | | (4 | ) |
Unredeemed capital expenditure | | | (105 | ) | | | (124 | ) |
Provisions, including non-current provisions | | | (27 | ) | | | (37 | ) |
Tax losses | | | (58 | ) | | | (51 | ) |
| |
Non-current assets reclassified as held for sale | | | (6 | ) | | | 3 | |
| |
Net deferred tax liability | | | 383 | | | | 386 | |
| |
| | | | | | | | |
Movement in the net deferred tax liability recognized in the balance sheet is as follows: | | | | | | | | |
| | | | | | | | |
At the beginning of the year | | | 386 | | | | 324 | |
Total charge per income statement (a) | | | 47 | | | | 46 | |
Foreign currency translation adjustments | | | (41 | ) | | | 13 | |
Tax directly charged to equity (b) | | | (4 | ) | | | — | |
Non-current assets reclassified as held for sale | | | (5 | ) | | | 3 | |
| |
At the end of the year | | | 383 | | | | 386 | |
| |
F-30
The following amounts that will realize or be recovered in the next 12 months have been included inthe deferred tax liabilities and assets:
| | | | | | | | | |
| | | US Dollar | |
| |
| Figures in million | | 2008 | | | 2007 | |
| |
Deferred tax liabilities | | | 38 | | | | 16 | |
Deferred tax assets | | | (21 | ) | | | (17 | ) |
| |
| | | 17 | | | | (1 | ) |
| |
As at June 30, 2008, certain subsidiaries in the Group have unredeemed capital expenditure of US$1 195.2million (2007: US$1 235.2 million) (2006: US$1 087.4 million) available against future mining taxableincome, tax losses carried forward of US$337.9 million (2007: US$197.6 million) (2006: US$349.7 million)and Capital Gains Tax (“CGT”) losses of US$73.2 million (at 50%) are available to be utilized againstfuture CGT gains and taxable income. These future deductions are utilizable against income.
As at June 30, 2008, the Group has not recognized the deferred tax asset amountof US$330.1 million resulting from unredeemed capital expenditure of US$795.6million, tax losses of US$132.9 million and CGT losses of US$73.2 million inthe determination of the net deferred tax liability.
| | (a) | | The charge includes the amounts for both continuing and discontinued operations. |
| |
| | (b) | | The charge relates to deferred tax asset on the downward mark-to-marketadjustment during the year on available-for-sale financial assets by Australianoperations. See notes 19 and 27 in this regard. |
| 14 | | Non-current assets or disposal group held for sale and discontinued operations |
The assets and liabilities related to Mount Magnet and South Kal (operations in Australia),Orkney operations (operations in Northwest provinces), have been presented as held for salefollowing approval of the Group’s management and Board of Directors on April 20, 2007.
On December 6, 2007, the sale relating to the South Kal operation (operation in Australia)was concluded at a loss, net of tax, of US$7.6 million and the assets were derecognized.
On February 27, 2008, the sale relating to the Orkney operations (operations in the Northwestprovince) was concluded at a profit of US$8.9 million and the assets were derecognized.
The assets and liabilities relating to the Cooke 1, Cooke 2, Cooke 3, Cooke plant andrelating surface operations (operations in the Gauteng province) have been presented as heldfor sale following the approval of the Group’s management on October 16, 2007. Theseoperations were also deemed to be discontinued operations. As a result the comparative incomestatements have been restated for this reclassification.
Management is still intent on the disposal of Mount Magnet despite the assets being classifiedas held for sale for more than 12 months. Refer to note 39 for more detail.
The following represents the assets and liabilities of operations classified as held for sale.
| | | | | | | | | |
| | | US Dollar | |
| |
| Figures are in million | | 2008 | | | 2007 | |
| |
| | | | | | | | |
Balance sheet | | | | | | | | |
| | | | | | | | |
Non-current assets classified as held for sale | | | | | | | | |
Property, plant and equipment | | | 152 | | | | 124 | |
Restricted cash | | | — | | | | 1 | |
Restricted investments | | | 22 | | | | 8 | |
Investment financial assets | | | — | | | | 1 | |
Deferred income tax | | | — | | | | 17 | |
Inventories | | | 22 | | | | 17 | |
Trade and other receivables | | | 1 | | | | 12 | |
Income and mining taxes | | | — | | | | 2 | |
| |
Total non-current assets classified as held for sale | | | 197 | | | | 182 | |
| |
F-31
| | | | | | | | | |
| | | US Dollar | |
| |
| Figures are in million | | 2008 | | | 2007 | |
| |
Balance sheet | | | | | | | | |
| | | | | | | | |
Liabilities directly associated with non-current assets classified as held for sale | | | | | | | | |
Deferred income tax | | | 6 | | | | 14 | |
Provisions for other liabilities and charges | | | 50 | | | | 36 | |
Trade and other payables | | | 8 | | | | 19 | |
Accrued liabilities | | | — | | | | 8 | |
| |
Total liabilities directly associated with non-current assets classified as held for sale | | | 64 | | | | 77 | |
| |
The results of operations and cash flows relating to assets held for sale have been classified asdiscontinued operations as follows:
| | | | | | | | | | | | | |
| | | US Dollar | |
| |
| Figures are in million | | 2008 | | | 2007 | | | 2006 | |
| |
| | | | | | | | | | | | |
Income statement | | | | | | | | | | | | |
| | | | | | | | | | | | |
Analysis of the results of discontinued operations,and the results recognized on the re-measurement ofassets for disposal by the Group | | | | | | | | | | | | |
| | | | | | | | | | | | |
Revenue | | | 312 | | | | 372 | | | | 327 | |
Expenses — net | | | (238 | ) | | | (373 | ) | | | (300 | ) |
Reversal of impairment/(impairment) | | | 5 | | | | (56 | ) | | | — | |
| |
Profit/(loss) from discontinued operations before tax | | | 79 | | | | (57 | ) | | | 27 | |
Taxation | | | (5 | ) | | | (9 | ) | | | (5 | ) |
| |
Taxation on impairment | | | (2 | ) | | | 16 | | | | — | |
Taxation on discontinued operations | | | (3 | ) | | | (25 | ) | | | (5 | ) |
| |
Profit/(loss) for the year from discontinued operations | | | 74 | | | | (66 | ) | | | 22 | |
| |
| | | | | | | | | | | | | |
| | | US Dollar | |
| |
| Figures are in million | | 2008 | | | 2007 | | | 2006 | |
| |
| | | | | | | | | | | | |
Cash flows | | | | | | | | | | | | |
| | | | | | | | | | | | |
Operating cash flows | | | 71 | | | | (17 | ) | | | 17 | |
Investing cash flows | | | (16 | ) | | | — | | | | 41 | |
Financing cash flows | | | — | | | | — | | | | (25 | ) |
Foreign exchange translation adjustment | | | (7 | ) | | | — | | | | (6 | ) |
| |
Total cash flows | | | 48 | | | | (17 | ) | | | 27 | |
| |
| 15 | | (Loss)/earnings per share |
Basic (loss)/earnings per share is calculated bydividing the net income attributable toshareholders by the weighted number of ordinaryshares in issue during the year.
| | | | | | | | | | | | | |
| | | US Dollar | |
| |
| | | 2008 | | | 2007 | | | 2006 | |
| |
| | | | | | | | | | | | |
Weighted average number of ordinary shares in issue (‘000) | | | 400,750 | | | | 397,911 | | | | 393,727 | |
| |
Net (loss)/profit from continuing operations | | | (104 | ) | | | 117 | | | | (113 | ) |
| |
Net profit/(loss) from discontinued operations | | | 74 | | | | (66 | ) | | | 22 | |
| |
Total net (loss)/profit attributable to shareholders | | | (30 | ) | | | 51 | | | | (91 | ) |
| |
Basic (loss)/earnings per share from continuing operations (cents) | | | (26 | ) | | | 29 | | | | (29 | ) |
| |
Basic earnings/(loss) per share from discontinued operations (cents) | | | 18 | | | | (17 | ) | | | 6 | |
| |
Total basic (loss)/earnings per share (cents) | | | (8 | ) | | | 12 | | | | (23 | ) |
| |
Fully diluted (loss)/earnings per share
For diluted earnings per share, the weighted average number of ordinary sharesin issue is adjusted to assume conversion of all potential dilutive ordinaryshares as a result of share options granted to employees under the share optionschemes in issue. A calculation is performed to determine the number of sharesthat could have been acquired at fair value, determined as the average annualmarket share price of the Company’s shares, based on the monetary value of thesubscription rights attached to the outstanding share options. The number ofshares calculated as above is compared with the number of shares that wouldhave been issued assuming the exercise of the share options.
F-32
| | | | | | | | | | | | | |
| | | US Dollar |
| Figures in million | | 2008 | | | 2007 | | | 2006 | |
| | | | | | | | | | | | |
Weighted average number of ordinary shares in issue (‘000) | | | 400,750 | | | | 397,911 | | | | 393,727 | |
Potential ordinary shares (‘000) | | | 2,144 | | | | 4,471 | | | | — | |
| |
Weighted average number of ordinary shares for fully diluted earnings per share (‘000) | | | 402,894 | | | | 402,382 | | | | 393,727 | |
| |
| | | | | | | | | | | | |
Fully diluted (loss)/earnings per share from continuing operations (cents) | | | (26 | ) | | | 29 | | | | (29 | ) |
Fully diluted earnings/(loss) per share from discontinued operations (cents) | | | 18 | | | | (17 | ) | | | 6 | |
| |
Total fully diluted (loss)/earnings per share (cents) | | | (8 | ) | | | 12 | | | | (23 | ) |
| |
The inclusion of share options issued to employees as at June 30, 2008, as potential ordinaryshares, had an anti-dilutive effect on the diluted loss per share. Additionally the potentialordinary shares to be issued upon the conversion of the convertible uncollateralized fixed ratebond (refer to note 28) had an anti-dilutive effect on the diluted earnings per share. Accordingly,such additional shares were not taken into account in the determination of the diluted loss pershare.
| 16 | | Property, plant and equipment |
| | | | | | | | | |
| | | US Dollar | |
| Figures in million | | 2008 | | | 2007 | |
| | | | | | | | |
Mining properties, mine development costs and mine plant facilities | | | 1,532 | | | | 1,438 | |
Mining assets under construction | | | 561 | | | | 404 | |
Undeveloped properties | | | 1,434 | | | | 1,621 | |
Deferred stripping | | | — | | | | 12 | |
Other non-mining assets | | | 4 | | | | 9 | |
| |
Total property, plant and equipment | | | 3,531 | | | | 3,484 | |
| |
| | | | | | | | |
Mining properties, mine development costs and mine plant facilities | | | | | | | | |
| | | | | | | | |
Cost | | | | | | | | |
Balance at beginning of year | | | 2,745 | | | | 2,791 | |
Additions | | | 316 | | | | 204 | |
Disposals | | | (174 | ) | | | (2 | ) |
Adjustment to rehabilitation asset | | | 13 | | | | 54 | |
Transfers and other movements | | | 166 | | | | — | |
Translation | | | (176 | ) | | | 108 | |
Net reclassification to held for sale | | | (369 | ) | | | (410 | ) |
| |
Balance at end of year | | | 2,521 | | | | 2,745 | |
| |
| | | | | | | | |
Accumulated depreciation | | | | | | | | |
Balance at beginning of year | | | 1,307 | | | | 1,387 | |
Impairment of fixed assets (a) | | | 13 | | | | 55 | |
Disposals | | | (104 | ) | | | — | |
Depreciation for the year (a) | | | 118 | | | | 158 | |
Depreciation for the year capitalized to mining assets under construction | | | 6 | | | | — | |
Transfers and other movements | | | — | | | | — | |
Translation | | | (34 | ) | | | 36 | |
Net reclassification to held for sale | | | (317 | ) | | | (329 | ) |
| |
Balance at end of year | | | 989 | | | | 1,307 | |
| |
Net book value | | | 1,532 | | | | 1,438 | |
| |
| | | | | | | | |
F-33
| | | | | | | | | |
| | | US Dollar | |
| Figures in million | | 2008 | | | 2007 | |
| |
| | | | | | | | |
Miningassets under construction | | | | | | | | |
| | | | | | | | |
Cost | | | | | | | | |
Balance at beginning of year as previously reported | | | 384 | | | | 208 | |
Effect of change in accounting policy (note 2.1) | | | 20 | | | | 11 | |
| |
Restated balance at beginning of year | | | 404 | | | | 219 | |
Additions (b) | | | 233 | | | | 166 | |
Finance costs capitalized | | | 22 | | | | 8 | |
Disposals | | | (4 | ) | | | — | |
Transfers and other movements | | | (84 | ) | | | — | |
Translation | | | (13 | ) | | | 14 | |
Net reclassification from/(to) held for sale | | | 3 | | | | (3 | ) |
| |
Book value | | | 561 | | | | 404 | |
| |
| | | | | | | | |
Undeveloped property | | | | | | | | |
| | | | | | | | |
Cost | | | | | | | | |
Balance at beginning of year | | | 1,630 | | | | 1,705 | |
Additions | | | — | | | | 5 | |
Disposals | | | (24 | ) | | | (3 | ) |
Transfers and other movements | | | (74 | ) | | | — | |
Translation | | | (80 | ) | | | 29 | |
Net reclassification to held for sale | | | (16 | ) | | | (106 | ) |
| |
Balance at end of year | | | 1,436 | | | | 1,630 | |
| |
| | | | | | | | |
Accumulated depreciation | | | | | | | | |
Balance at beginning of year | | | 9 | | | | 76 | |
Reversal on impairment of fixed assets (a) | | | (6 | ) | | | (10 | ) |
Depreciation for the year (a) | | | — | | | | 1 | |
Transfers and other movements | | | 9 | | | | — | |
Translation | | | 16 | | | | 9 | |
Net reclassification to held for sale | | | (26 | ) | | | (67 | ) |
| |
Balance at end of year | | | 2 | | | | 9 | |
| |
Net book value | | | 1,434 | | | | 1,621 | |
| |
| | | | | | | | |
Deferred stripping | | | | | | | | |
| | | | | | | | |
Cost | | | | | | | | |
Balance at beginning of year | | | 12 | | | | 13 | |
Translation | | | (1 | ) | | | — | |
Reversal of deferred costs | | | (3 | ) | | | (1 | ) |
| |
Balance at end of year | | | 8 | | | | 12 | |
| |
| | | | | | | | |
Accumulated depreciation | | | | | | | | |
Balance at beginning of year | | | — | | | | 9 | |
Impairment/(reversal of impairment) of fixed assets | | | 8 | | | | (9 | ) |
| |
Balance at end of year | | | 8 | | | | — | |
| |
Net book value | | | — | | | | 12 | |
| |
| | | | | | | | |
Other non-mining assets | | | | | | | | |
| | | | | | | | |
Cost | | | | | | | | |
Balance at beginning of year | | | 46 | | | | 48 | |
Additions | | | 2 | | | | — | |
Disposals | | | (5 | ) | | | — | |
Transfers and other movements | | | 4 | | | | — | |
Translation | | | (6 | ) | | | 2 | |
Net reclassification from/(to) held for sale | | | 3 | | | | (4 | ) |
| |
Balance at end of year | | | 44 | | | | 46 | |
| |
| | | | | | | | |
F-34
| | | | | | | | | |
| | | US Dollar | |
| Figures in million | | 2008 | | | 2007 | |
Accumulated depreciation | | | | | | | | |
Balance at beginning of year | | | 37 | | | | 38 | |
Disposals | | | (4 | ) | | | — | |
Depreciation for the year (a) | | | 4 | | | | 2 | |
Transfers and other movements | | | 4 | | | | — | |
Translation | | | (4 | ) | | | — | |
Net reclassification from/(to) held for sale | | | 3 | | | | (3 | ) |
| |
Balance at end of year | | | 40 | | | | 37 | |
| |
Net book value | | | 4 | | | | 9 | |
| |
Total net book value | | | 3,531 | | | | 3,484 | |
| |
| | |
| (a) | | The amounts include both continuing and discontinued operations. |
| |
| (b) | | Included in these additions are royalty agreements that Rio Tinto had over the Hidden Valley andKerimenge deposits in Papua New Guinea (“PNG”). In terms of the royalty agreement, Rio Tinto had therights to receive a portion of between 2% and 3.5% of future ounces produced by the Hidden Valleymine in PNG. During March 2008, Harmony concluded the buy back of these royaltyrights for US$22.5 million through the issue of US$20 million Harmony shares and US$2.5 million incash. |
| |
| (c) | | Additional disclosures |
| | | | | | | | | |
| | | US Dollar | |
| Figures in million | | 2008 | | | 2007 | |
| | | | | | | | |
Leased assets | | | | | | | | |
Carrying value of capitalized leased assets (included in mining assets under construction) | | | 34 | | | | — | |
| |
Cost | | | 37 | | | | — | |
Accumulated depreciation | | | (3 | ) | | | — | |
| |
Finance lease additions | | | 35 | | | | — | |
| |
| | | | | | | | | |
| | | US Dollar | |
| Figures in million | | 2008 | | | 2007 | |
| | | | | | | | |
Goodwill | | | | | | | | |
| | | | | | | | |
Cost | | | | | | | | |
Balance at beginning of year (a) | | | 337 | | | | 331 | |
Translation | | | (33 | ) | | | 6 | |
| |
Balance at end of year | | | 304 | | | | 337 | |
| |
| | | | | | | | |
Accumulated impairment | | | | | | | | |
Balance at beginning of year | | | 15 | | | | 15 | |
Impairment loss (b) | | | 13 | | | | — | |
Translation | | | (1 | ) | | | — | |
| |
Balance at end of year | | | 27 | | | | 15 | |
| |
Net book value | | | 277 | | | | 322 | |
| |
| | | | | | | | |
Computer software | | | | | | | | |
| | | | | | | | |
Cost | | | | | | | | |
Balance at the beginning of year (c) | | | 6 | | | | — | |
Acquired during the year (d) | | | 3 | | | | 7 | |
Translation | | | (1 | ) | | | — | |
| |
Balance at end of year | | | 8 | | | | 7 | |
| |
| | | | | | | | |
Accumulated amortization | | | | | | | | |
Balance at the beginning of year | | | 1 | | | | — | |
Amortization charge for the year | | | 2 | | | | 1 | |
Translation | | | (1 | ) | | | — | |
| |
Balance at end of year | | | 2 | | | | 1 | |
| |
F-35
| | | | | | | | | |
| | | US Dollar | |
| Figures in million | | 2008 | | | 2007 | |
Net book value | | | 6 | | | | 6 | |
| |
Total net book value | | | 283 | | | | 328 | |
| |
| | | |
| (a) | | The opening carrying value of goodwill relates to the acquisition of ARMgold on September 22,2003. |
The net book value amount of goodwill has been allocated to the each of the cash generating unitsas follows:
| | | | | | | | | |
| | | US Dollar | |
| Figures in million | | 2008 | | | 2007 | |
Bambanani | | | 29 | | | | 32 | |
Tshepong | | | 72 | | | | 152 | |
Phakisa | | | 170 | | | | 116 | |
Other | | | 6 | | | | 22 | |
| |
| | | 277 | | | | 322 | |
| |
During the 2008 financial year, a resource transfer took place between Tshepong and Phakisa and anadjustment was made to the related goodwill.
| | | |
| (b) | | The impairment of goodwill relates to goodwill allocated to other underground segments. Therelated mining assets have also been impaired. Refer to note 5 (e). |
| |
| (c) | | The opening net book value relates to the acquisition of the Oracle ERP software implemented inDecember 2006. |
| |
| (d) | | The amount above relates to additional development costs for the Oracle ERP software during theyear. |
| 18 | | Restricted investments |
| | | | | | | | | |
| | | US Dollar | |
| Figures in million | | 2008 | | | 2007 | |
| | | | | | | | |
Investments held by Environmental trust funds (a) | | | 206 | | | | 198 | |
Investments held by Social trust fund (b) | | | 5 | | | | 5 | |
| |
Total restricted investments | | | 211 | | | | 203 | |
Reclassified as non-current assets held for sale | | | (23 | ) | | | (8 | ) |
| |
| | | 188 | | | | 195 | |
| |
| | | |
| (a) | | The environmental trust funds are irrevocable trusts under the Group’s control. Contributionsto the trust are invested primarily in interest-bearing short-terminvestments. The costs of these investmentsapproximate their fair values. The investments provide for the estimated cost of rehabilitationduring and at the end of the life of the Group’s mines. Income earned on the investments arerestricted in use and may only be used to fund the Group’s approved rehabilitation costs. |
Reconciliationof the movement in the Environmental trust fund:
| | | | | | | | | |
| | | US Dollar | |
| Figures in million | | 2008 | | | 2007 | |
| | | | | | | | |
Opening balance | | | 197 | | | | 180 | |
Interest accrued | | | 21 | | | | 16 | |
Disposal of business | | | (4 | ) | | | — | |
Contributions made | | | 11 | | | | 2 | |
Reimbursement of costs incurred | | | — | | | | (2 | ) |
Translation | | | (19 | ) | | | 2 | |
| |
Closing balance | | | 206 | | | | 198 | |
Non-current assets held for sale | | | (23 | ) | | | (8 | ) |
| |
| | | 183 | | | | 190 | |
| |
F-36
| | |
| (b) | | The Social trust fund is an irrevocable trust under the Group’s control. The Group hasundertaken to donate over a period of 10 years to The Harmony Gold Mining Group Social Plan Trustin terms of an agreement signed on November 3, 2003. An initial donation of US$2.7 million was madeduring the 2004 year. The balance will be donated in installments of R3.5 million (US$0.45 million)per annum with the final installments to be made in 2013. The purpose of the Trust is to fund thesocial plan to reduce the negative effects of restructuring on the Group’s workforce, to putmeasures in place to ensure that the technical and life skills of the Group’s workforce aredeveloped and to develop the Group’s workforce in such a manner to avoid or minimize the effect ofjob losses and a decline in employment through turnaround or redeployment strategies. |
Reconciliationof the movement in the Social trust fund:
| | | | | | | | | |
| | | US Dollar | |
| Figures in million | | 2008 | | | 2007 | |
| |
| | | | | | | | |
Opening balance | | | 5 | | | | 4 | |
Contributions made | | | 1 | | | | 1 | |
Interest accrued | | | — | | | | — | |
Claims paid | | | (1 | ) | | | — | |
| |
Closing balance | | | 5 | | | | 5 | |
| |
| 19 | | Investment in financial assets |
| | | | | | | | | |
| | | US Dollar | |
| Figures in million | | 2008 | | | 2007 | |
| |
| | | | | | | | |
Beginning of the year | | | 361 | | | | 137 | |
Additions | | | 20 | | | | 309 | |
Disposals | | | (362 | ) | | | (50 | ) |
Mark-to-market | | | (8 | ) | | | (50 | ) |
Profit onnon-derivative financial instruments (refer note 9) | | | 5 | | | | 16 | |
Translation | | | (7 | ) | | | — | |
| |
| | | 9 | | | | 362 | |
Reclassified as current assets | | | — | | | | (353 | ) |
Reclassified as non-current assets held for sale | | | — | | | | (1 | ) |
| |
End of the year | | | 9 | | | | 8 | |
| |
The carrying amount consists of the following:
| | | | | | | | | |
Available-for-sale financial assets | | | | | | | | |
Investment in Clidet No. 700 (Pty) Ltd (a) | | | — | | | | 7 | |
Investment in Alloy Resources (b) | | | — | | | | 1 | |
Investment in Gold Fields Limited (c) | | | — | | | | 204 | |
Investment in Dioro Exploration NL (d) | | | 8 | | | | — | |
Investment in other unlisted shares(e) | | | 1 | | | | 1 | |
| |
| | | 9 | | | | 213 | |
Reclassified as current assets | | | — | | | | (353 | ) |
Reclassified as non-current assets held for sale | | | — | | | | (1 | ) |
| |
Total available-for-sale financial assets | | | 9 | | | | (141 | ) |
At fair value through profit or loss | | | | | | | | |
Investment in African Rainbow Minerals Limited (f) | | | — | | | | 149 | |
| |
| | | 9 | | | | 8 | |
| |
| | |
| (a) | | On December 11, 2006, Harmony subscribed to 50,000 cumulative redeemable participatingpreference shares in Clidet No 700 (Proprietary) Limited (“Clidet 700”) for US$7.1 million. Thepurchase consideration was paid on January 3, 2007. Clidet 700used these funds to purchase 4,106,667ordinary shares in Pamodzi Gold Limited (“Pamodzi”), which listed on the JSE Limited (JSE) onDecember 11, 2006. Clidet 700 has ceded the Pamodzi shares to Harmony as security for the amountsowing in terms of the redemption of the preference shares. The preference shares may be redeemedafter May 1, 2009 by Clidet 700, or after three years and one day from the issue date by Harmony.Dividends are accumulated and are payable on the redemption date, if not paid before. |
The preference shares were redeemed on April 10, 2008 for US$7.3 million.
| | |
| (b) | | On April 3, 2006, Big Bell Gold Operations (Pty) Ltd, a subsidiary of Harmony Gold (Australia)(Proprietary) Limited, received |
F-37
5,000,000 shares, valued at A$0.20 (US$0.14) per share, in AlloyResources, as partial consideration for the sale of Comet tenements. The market value of theinvestment was US$0.3 million (A$0.05 (US$0.048) per share) on June 30, 2008 (2007: US$0.6 million(A$0.15 (US$0.13) per share)), resulting in a decrease of US$0.3 million for the year, which wasreflected as other comprehensive income. This investment has now been included in non-currentassets held for sale.
| | |
| (c) | | On December 8, 2006, the Group received 15,745,079 ordinary shares in Gold Fields, issuedat R135.02 (US$19.15) per share, in exchange for its interest in Western Areas. This was in termsof the offer by Gold Fields to exchange every 100 Western Areas shares held for 35 Gold Fieldsshares. Gold Fields is a mineral resources company, primarily gold, which is listed on the JSE andhas a secondary listing on the New York Stock Exchange. |
TheGroup disposed of 1,150,000 shares for US$19.7 million in four transactions between January 26,2007 and February 12, 2007. The total cost of these shares was US$21.4 million, resulting in arealized loss of US$1.7 million. During May and June 2007,a further 1,500,000 shares with a costof US$28.3 million were disposed of for US$25.1 million, resulting in a realized loss of US$3.2million. After this transaction, the Group still held 7,348,079 shares in Gold Fields, after takinginto account the 5,747,000 shares pledged to RMB Morgan Stanley (RMB) in terms of the financing.See note 28 (f) in this regard.
On August 24, 2007 the Group entered into an agreement with RMB to sell the remaining Gold Fieldsordinary shares at R100 (US$13.83) per ordinary share, resulting in a realized loss of R35.02(US$4.84) per share. The proceeds of US$182.9 million were used to settle the Randfonteinredeemable preference shares issued to RMB on April 5, 2007,as well as the RMB financing. See note28 (f) and (g).
| | |
| (d) | | On December 5, 2007, the Group concluded an agreement with Dioro Exploration NL (Dioro) tosell its South Kal operation (Australia) in exchange for 11,428,571 shares in Dioro, constitutingan investment of 17.6%. At that date the shares were valued at US$18.9 million being A$1.75(US$1.52) per share. The shares are listed on the Australian Securities Exchange. At year end theshares were valued at A$0.74 (US$0.71), resulting in US$8.1 million being recognized in other comprehensiveincome, net of tax. |
| |
| (e) | | Investments are held in various shares of unlisted industry-related companies. Theseinvestments have been valued by the directors by performing independent valuations on an annualbasis to ensure that no permanent impairment in the value of the investments has occurred. Duringthe financial year under review, the Group did not receive any income from these investments (2007: Nil). |
| |
| (f) | | During the 2005 financial year, the Group transferred its remaining 13.68% of the investment inARM to the ARM Broad-Based Economic Empowerment Trust (“the ARM Trust”) for an aggregate cashconsideration of $132.1 million, representing a price of R29 (US$4.62) per ARM share. |
The acquisition of the shares by the ARM Trust was financed through two term loan facilities withNedbank Limited (“Nedbank”). The first term loan facility of $75.4 million previously contained aput option whereby Nedbank could have put the loan to the Group in the event of default by the ARMTrust. The Group was also entitled, at any time up to the facilities discharge date, to call theloan and “step into the shoes of Nedbank as the lender”. During the 2006 financial year, this putand call option was replaced by a guarantee from Harmony to the value of $54.0 million, plusinterest accrued at the applicable funding rate. On the same date, the Group received an indemnityfrom ARM to the value of 50% of the Group’s liability under the guarantee. The second term loanfacility amounting to $56.7 million continued to be collateralized by the underlying ARM shares inthe ARM Trust. Nedbank is entitled to force the trust to sell the shares if the market price of theARM shares decrease to a certain level.
For accounting purposes, the Group did not account for the transfer of the shares to the ARM Trustas a sale. This is because the previous put and call option on the first term loan facility, aswell as the guarantee, resulted in the majority of the risks not being transferred away fromHarmony, and the 13.68% investment therefore continued to beaccounted for as available-for-sale.Harmony also considered the appropriate accounting for the fact that, in terms of the statedobjective of the ARM Trust, the upside on appreciation of the ARM shares legally belongs to theintended beneficiaries of the ARM Trust and therefore limited the increase in fair value of theshares to its obligations under the Nedbank loans.
On September 28, 2007, the guarantee to Nedbank was cancelled and, as a result, Harmony has nofurther obligation to Nedbank. The investment in ARM and the associated Nedbank loans have beende-consolidated from that date.
F-38
| 20 | | Investments in associates |
| | | | | | | | | |
| | | US Dollar | |
| Figures in million | | 2008 | | | 2007 | |
| |
| | | | | | | | |
Opening carrying amount | | | 1 | | | | 266 | |
Disposal of share in associate (a) | | | — | | | | (268 | ) |
Joint venture becoming associate (c) | | | — | | | | 1 | |
Shares acquired at cost (d) | | | 46 | | | | — | |
Elimination of unrealized profits | | | (5 | ) | | | — | |
Share of loss after tax | | | (11 | ) | | | (3 | ) |
Impairment of share in associate | | | (12 | ) | | | — | |
Foreign currency translation reserve | | | — | | | | 5 | |
| |
Total investments in associates | | | 19 | | | | 1 | |
| |
| | | | | | | | |
The carrying amount consists of the following: | | | | | | | | |
Village Main Reef Gold Mining Company Ltd (b) | | | — | | | | — | |
Orpheo (c) | | | — | | | | 1 | |
Pamodzi Gold Limited (d) | | | 19 | | | | — | |
| |
Total investments in associates | | | 19 | | | | 1 | |
| |
| | |
| (a) | | On March 9, 2006, the Group acquired a 29.2% interest in the issued share capital ofWestern Areas (44,985,939 shares) through its subsidiary, the ARMgold/Harmony Joint InvestmentCompany (Proprietary) Limited, for a total cost of US$321.4 million. Western Areas was listed on the JSE Limited,with interests in operating gold mines in South Africa. |
On December 8, 2006, the Group disposed of its interest in Western Areas in exchange for GoldFields ordinary shares. This was in terms of an offer by Gold Fields whereby every 100 WesternAreas was exchanged for 35 Gold Fields shares. The Group received 15,745,079 Gold Fields shares forits 44,985,939Western Areas shares. The net profit on the transaction was US$34.7 million, calculated after theinvestment was reduced by the share of post-acquisition loss of US$18.1 million.
| | |
| (b) | | On June 21, 2006, Harmony acquired 37.8% of the issued share capital of Village Main ReefGold Mining Company (1934) Limited (“Village”) at a total cost of US$0.07 million. The equity stakewas purchased from ARM at a price of R0.20 (US$0.03) per share.Village is listed on the JSE Limited in the gold sector and has been dormant for some time withoutany operating mines. |
At June 30, 2008, the fair value of the investment was US$0.09 million, calculated on a share priceof R0.30 (US$0.04) per share.
During the twelve months to June 2008, the Group did not recognize its share of losses from theassociate. This unrecognized share amounted to US$0.08 million.
The unaudited summarized aggregated financial information for the twelve months ended June 30, 2008is as follows:
| | | | | | | | | |
| | | US Dollar | |
| Figures in million | | 2008 | | | 2007 | |
| |
| | 100% | | | 100% | |
| |
| | | | | | | | |
Revenue | | | — | | | | — | |
Net loss | | | — | | | | — | |
Total assets | | | 1 | | | | 1 | |
Total liabilities | | | 1 | | | | — | |
| |
| | |
| (c) | | During 2007, the Group disposed of 17% of its share in Orpheo by Harmony (Proprietary) Limited(“Orpheo”), which had been accounted for as a joint venture. After the transaction, the Group helda 33% interest in Orpheo. |
The Group originally purchased its 50% share for US$0.7 million. The consideration for the disposalwas US$0.2 million and the fair value of the portion disposed was US$0.2 million, resulting in aUS$0.03 million profit.
F-39
At June 30, 2008, the fair value of the investment was evaluated by management. It was determinedthat the carrying value exceeded the fair value and an impairment of US$0.06 million wasrecognized.
During the 12 months ended June 30, 2008, the Group’s share of post-acquisition profit was US$0.04million.
The unaudited summarized financial information for the twelve months ended June 30, 2008 is asfollows:
| | | | | | | | | |
| | | US Dollar | |
| | | 2008 | | | 2007 | |
| Figures in million | | 100% | | | 100% | |
| |
| | | | | | | | |
Revenue | | | 1 | | | | 1 | |
Net profit | | | — | | | | — | |
Total assets | | | 1 | | | | 1 | |
Total liabilities | | | 1 | | | | — | |
| |
| | (d) | | On February 27, 2008, Pamodzi bought the Orkney operations from Harmony for a consideration of 30,000,000 Pamodzi shares. This resulted in Harmony owning32.4% of Pamodzi. On the purchase date the value of the investment was R11.50 per share (US$1.54per share) resulting in US$46.5 million investment. Pamodzi islisted on the JSE Limited and has interestsin operating gold mines in South Africa. |
| |
| | | | As at June 30, 2008 the fair value of the investment was calculated at US$18.6 million (R4.85(US$0.62) per share). The carrying value exceeded the fair value and as a result, an impairment ofUS$12.3 million was recognized. During the four months to June 2008, the Group’s share of the postacquisition losses was a loss of US$10.6 million. |
| |
| | | | Pamodzi has a December 31 year-end and the latest audited financials are for the year endedDecember 31, 2007. The unaudited financial information of Pamodzi for the period since acquisitionof the investment on February 27, 2008 to June 2008 and asat June 30, 2008 are as follows: |
| | | | | |
| | | US Dollar | |
| | | 2008 | |
| Figures in million | | 100% | |
| |
| | | | |
Revenue | | | 57 | |
Production costs | | | (74 | ) |
| |
Operating loss | | | (17 | ) |
| |
| | | | |
Net loss | | | (34 | ) |
| |
| | | | |
Non-current assets | | | 214 | |
Current assets | | | 21 | |
| |
Total assets | | | 235 | |
| |
| | | | |
Current liabilities | | | 170 | |
Non-current liabilities | | | 31 | |
| |
Total liabilities | | | 201 | |
| |
| 21 | | Investment in joint venture |
The Group held a joint venture interest in Healthshare Health Solutions (Proprietary) Limited (“Healthshare”)(45%). The interest in Healthshare was acquired on December 20, 2005. On January 1, 2008, theGroup disposed of its interest to the remaining shareholders of Healthshare and derecognized itsshare in assets and liabilities. A loss of US$0.3 million was recognized.
For the six month period ending December 31, 2007 the Group’s share of the joint venture profitamounted to US$0.4 million.
F-40
| 22 | | Trade and other receivables |
| | | | | | | | | |
| | | US Dollar | |
| Figures in million | | 2008 | | | 2007 | |
| |
| | | | | | | | |
Current | | | | | | | | |
Financial assets: | | | | | | | | |
Trade receivables (gold) | | | 30 | | | | 11 | |
| |
Other trade receivables | | | 44 | | | | 20 | |
Provision for impairment | | | (17 | ) | | | (3 | ) |
| |
Trade receivables — net | | | 57 | | | | 28 | |
Interest and other receivables | | | 9 | | | | — | |
Employee receivables | | | 3 | | | | 8 | |
Insurance claims receivable | | | — | | | | 16 | |
Deferred consideration for sale of Buffalo Creek (a) | | | — | | | | 5 | |
| | | | | | | | |
Non-financial assets: | | | | | | | | |
Prepayments | | | 5 | | | | 5 | |
Value added tax | | | 38 | | | | 68 | |
| |
Total current trade and other receivables | | | 112 | | | | 130 | |
| |
| | | | | | | | |
Non-current | | | | | | | | |
Financial assets: | | | | | | | | |
Loans receivables (b) | | | 20 | | | | 10 | |
Provision for impairment | | | (2 | ) | | | (2 | ) |
| |
Total non-current trade and other receivables | | | 18 | | | | 8 | |
| |
| | | |
| (a) | | On March 31, 2006, the Group disposed of the entire share capital of Buffalo Creek for US$17.2million. The last installment of the receivable was settled in cash on September 30, 2007. |
| |
| (b) | | Loans comprise various loans, which have been valued by the directors. These loans areuncollateralized with interest charged at the South African primelending rate (“prime”). These loans are duewithin two years. Included in this balance is US$13.2 million owed by an associate. |
The movement in the provision for impairment of trade and other receivables during the year was as follows:
| | | | | | | | | |
| | | US Dollar | |
| Figures in million | | 2008 | | | 2007 | |
| |
| | | | | | | | |
Balance at July 1 | | | 3 | | | | 2 | |
Impairment loss recognized | | | 14 | | | | 1 | |
| |
Balance at June 30 | | | 17 | | | | 3 | |
| |
The movement in the provision for impairment of loans receivables during the year was as follows:
| | | | | | | | | |
| | | US Dollar | |
| Figures in million | | 2008 | | | 2007 | |
| |
| | | | | | | | |
Balance at July 1 | | | 2 | | | | — | |
Impairment loss recognized | | | 1 | | | | 2 | |
Loans written off during the year | | | (1 | ) | | | — | |
| |
Balance at June 30 | | | 2 | | | | 2 | |
| |
| | | | | | | | | |
| | | US Dollar | |
| Figures in million | | Gross | | | Impairment | |
| |
| | | | | | | | |
The ageing of trade and other receivables at the reporting date was: | | | | | | | | |
| | | | | | | | |
June 30, 2008 | | | | | | | | |
| | | | | | | | |
Fully performing | | | 51 | | | | — | |
Past due by 1 to 30 days | | | 3 | | | | — | |
Past due by 31 to 60 days | | | — | | | | — | |
Past due by 61 to 90 days | | | 1 | | | | — | |
Past due by more than 90 days | | | 19 | | | | 17 | |
| |
Balance at June 30, 2008 | | | 74 | | | | 17 | |
| |
F-41
| | | | | | | | | |
| | | US Dollar | |
| Figures in million | | Gross | | | Impairment | |
| |
| | | | | | | | |
June 30, 2007 | | | | | | | | |
| | | | | | | | |
Fully performing | | | 23 | | | | — | |
Past due by 1 to 30 days | | | 1 | | | | — | |
Past due by 31 to 60 days | | | — | | | | — | |
Past due by 61 to 90 days | | | 3 | | | | — | |
Past due by more than 90 days | | | 5 | | | | 3 | |
| |
Balance at June 30, 2007 | | | 32 | | | | 3 | |
| |
| | | | | | | | | |
| | | US Dollar | |
| Figures in million | | Gross | | | Impairment | |
| |
| | | | | | | | |
The ageing of loans receivables at the reporting date was: | | | | | | | | |
| | | | | | | | |
June 30, 2008 | | | | | | | | |
| | | | | | | | |
Fully performing | | | 18 | | | | — | |
Past due by 1 to 30 days | | | — | | | | — | |
Past due by 31 to 60 days | | | — | | | | — | |
Past due by 61 to 90 days | | | — | | | | — | |
Past due by more than 90 days | | | 2 | | | | 2 | |
| |
Balance at June 30, 2008 | | | 20 | | | | 2 | |
| |
| | | | | | | | |
June 30, 2007 | | | | | | | | |
| | | | | | | | |
Fully performing | | | 8 | | | | — | |
Past due by 1 to 30 days | | | — | | | | — | |
Past due by 31 to 60 days | | | — | | | | — | |
Past due by 61 to 90 days | | | — | | | | — | |
Past due by more than 90 days | | | 2 | | | | 2 | |
| |
Balance at June 30, 2007 | | | 10 | | | | 2 | |
| |
Based on past experience, the Group believes that no impairment allowance is necessary in respectof fully performing trade receivables as the amount relates to customers that have a good trackrecord with the Group. Trade receivables that are less than 90 days past due are not considered to be impaired.
The Group holds the Deelkraal surface assets as collateral for the balance outstanding on the saleof these assets to Ogoerion Construction CC (included in trade receivables above). The balance ofUS$6.4 million was impaired during the 2008 financial year.
Managementexpect to recover the full amount outstanding on fully performing loans receivable.
During 2008 and 2007 there was no renegotiation of the terms of any receivable, other than asdiscussed above.
| | | | | | | | | |
| | | US Dollar | |
| Figures in million | | 2008 | | | 2007 | |
| |
| | | | | | | | |
Gold in lock-up | | | 26 | | | | 23 | |
Gold in-process and bullion on hand | | | 17 | | | | 49 | |
Stores and materials at weighted average cost | | | 46 | | | | 33 | |
| |
Total inventories | | | 89 | | | | 105 | |
| |
| | | | | | | | |
Gold in-process at the following operations is valued at net realizable value: | | | | | | | | |
| | | | | | | | |
Free State | | | — | | | | 4 | |
Evander | | | — | | | | 11 | |
Freegold | | | — | | | | 12 | |
Target | | | — | | | | 13 | |
| |
Gold in-process carried at net realizable value | | | — | | | | 40 | |
| |
Gold in-process includes immaterial amounts of stockpile inventories.
F-42
Duringthe year, US$1.4 million (2007: US$0.8 million) was provided for slow moving and obsoletestock. The total provision for 2008 was US$3.3 million (2007: US$1.9 million).
| | | | | | | | | |
| | | US Dollar | |
| Figures in million | | 2008 | | | 2007 | |
| |
| | | | | | | | |
RMB margin call account (a) | | | — | | | | 39 | |
Security deposits (b) | | | — | | | | 2 | |
Cash Management Account (c) | | | 10 | | | | — | |
Reclassified as current | | | — | | | | (39 | ) |
Reclassified as non-current assets held for sale | | | — | | | | (1 | ) |
| |
Total restricted cash | | | 10 | | | | 1 | |
| |
| | |
| (a) | | In terms of the financing agreement with RMB, US$39 million was placed in a securitydeposit account with RMB. Refer to note 28 (f). |
| |
| (b) | | The amount was held in respect of security deposits on mining tenements. |
| |
| (c) | | The amount relates to funds set aside by the International operations for performance bonds relatedto guarantees for environmental obligations. |
| 25 | | Cash and cash equivalents |
| | | | | | | | | |
| | | US Dollar | |
| Figures in million | | 2008 | | | 2007 | |
| |
| | | | | | | | |
Cash at bank and deposits on call | | | 53 | | | | 101 | |
Overdraft facilities | | | — | | | | (31 | ) |
| |
Total cash and cash equivalents | | | 53 | | | | 70 | |
| |
Authorized
1,200,000,000(2007: 1,200,000,000) ordinary shares of R0.50 each
10,958,904(2007: 10,958,904) redeemable convertible preference shares of R0.50 each
Issued
403,253,756(2007: 399,608,384) ordinary shares of R0.50 each
The unissued shares are under the control of the directors until the forthcoming annual generalmeeting. Note 35 sets out details in respect of the share option scheme.
The Company has a general authority to purchase its shares up to a maximum of 10% of the issuedshare capital in any one financial year. This is in terms of the annual general meeting ofshareholders on November 26, 2007. The general authority is subject to the Listings Requirements ofthe JSE Securities Exchange South Africa and the Companies Act no 61 of 1973 of South Africa, asamended.
F-43
27 Other reserves
Other reserves comprises:
| | | | | | | | | |
| | | US Dollar | |
| Figures in million | | 2008 | | | 2007 | |
| |
| | | | | | | | |
Foreign exchange translation reserve (a) | | | (216 | ) | | | 30 | |
Mark-to-market of available-for-sale financial instruments (b) | | | (2 | ) | | | (44 | ) |
Equity component of convertible bond (c) | | | 41 | | | | 41 | |
Acquisition of non-controlling interest in subsidiary (d) | | | (57 | ) | | | (57 | ) |
Deferred share-based payments (e) | | | 42 | | | | 36 | |
Other | | | (4 | ) | | | (4 | ) |
| |
Total other reserves | | | (196 | ) | | | 2 | |
| |
| | | | | | | | |
The different categories are made up as follows: | | | | | | | | |
Foreign exchange translation reserve | | | | | | | | |
| | | | | | | | |
At the beginning of the year | | | 30 | | | | (57 | ) |
Current year’s foreign exchange movement | | | (246 | ) | | | 87 | |
| |
At the end of the year | | | (216 | ) | | | 30 | |
| |
| | | | | | | | |
Mark-to-market of available-for-sale financial assets | | | | | | | | |
| | | | | | | | |
At the beginning of the year | | | (44 | ) | | | 2 | |
Realized portion reclassified through profit or loss | | | 47 | | | | 4 | |
Mark-to-market — unrealized | | | (9 | ) | | | (50 | ) |
Deferred tax asset | | | 4 | | | | — | |
| |
At the end of the year | | | (2 | ) | | | (44 | ) |
| |
| | | | | | | | |
Equity component of convertible bond | | | | | | | | |
| | | | | | | | |
At the beginning/end of the year | | | 41 | | | | 41 | |
| |
| | | | | | | | |
Acquisition of non-controlling interest in subsidiary | | | | | | | | |
| | | | | | | | |
At the beginning/end of the year | | | (57 | ) | | | (57 | ) |
| |
| | | | | | | | |
Deferred share-based payments | | | | | | | | |
| | | | | | | | |
At the beginning of the year | | | 36 | | | | 30 | |
Share-based payments expensed | | | 6 | | | | 6 | |
| |
At the end of the year | | | 42 | | | | 36 | |
| |
| | | | | | | | |
Other reserves | | | | | | | | |
| | | | | | | | |
At the beginning/end of the year | | | (4 | ) | | | (4 | ) |
| |
| | |
| (a) | | The movement of the foreign exchange translation reserve represents the cumulativetranslation effect of the Group’s off-shore operations. It also includes the translation effectfrom Rand to US Dollar. |
| |
| (b) | | The balance of the mark-to-market reserve represents the movement in the fair value ofthe available-for-sale financial assets. For details on the movement, refer to note 19. |
| |
| (c) | | On May 21, 2004, the Group issued a convertible bond. As a result, an amount representingthe value of the equity conversion component is included in other reserves, net of deferred tax.The equity conversion component is determined on the issue of the bonds and is not changed insubsequent periods. Refer to note 28 (a) for more detail. |
| |
| (d) | | On March 15, 2004 Harmony announced that it had made an off market cash offer to acquireall the ordinary shares, listed and unlisted options of Abelle, held by non-controlling interests.The excess of the purchase price of US$86.5 million (A$123 million) over the carrying amount ofnon-controlling interests acquired, amounting to US$55 million, has been accounted for under otherreserves. |
F-44
| | |
| (e) | | The Group issues equity-settled instruments to certain qualifying employees under an EmployeeShare Option Scheme to purchase shares in the Company’s authorized but unissued ordinary shares.Equity share-based payments are measured at the fair value of the equity instruments at the dateof the grant. Share-based payment are expensed over the vesting period, based on the Group’sestimate of the shares that are expected to eventually vest. During 2008 a share-based paymentexpense of US$5.9 million (2007: US$6.3 million) was charged to the income statement. (Refer tonote 35 for more detail.) |
28 Borrowings
| | | | | | | | | |
| | | US Dollar | |
| |
| Figures in million | | 2008 | | | 2007 | |
| |
| | | | | | | | |
Uncollateralized borrowings | | | | | | | | |
| | | | | | | | |
Convertible uncollateralized fixed rate bonds (a) | | | — | | | | 219 | |
| |
Principal amount | | | 218 | | | | 241 | |
Equity conversion component, net of deferred tax liability | | | (41 | ) | | | (41 | ) |
Deferred tax liability | | | (9 | ) | | | (9 | ) |
| |
Liability component on initial recognition | | | 168 | | | | 191 | |
Unwinding of time value of money portion | | | 40 | | | | 29 | |
Less: amortized bond issue costs | | | (1 | ) | | | (2 | ) |
Translation | | | 1 | | | | 1 | |
| |
| | | 208 | | | | 219 | |
Less: current portion | | | (208 | ) | | | — | |
| |
Africa Vanguard Resources (Proprietary) Limited (b) | | | 4 | | | | 5 | |
| |
Total uncollateralized long-term borrowings | | | 4 | | | | 224 | |
| |
| | | | | | | | |
Collateralized borrowings | | | | | | | | |
| | | | | | | | |
Nedbank Limited (c) | | | — | | | | 24 | |
| |
Liability amount | | | 25 | | | | 24 | |
Less: current portion | | | (25 | ) | | | — | |
| |
| | | | | | | | |
Nedbank Limited (d) | | | — | | | | — | |
| |
Liability amount | | | — | | | | 85 | |
Less: current portion | | | — | | | | (85 | ) |
| |
| | | | | | | | |
Nedbank Limited (e) | | | — | | | | — | |
| |
Liability amount | | | — | | | | 64 | |
Less: current portion | | | — | | | | (64 | ) |
| |
| | | | | | | | |
Rand Merchant Bank (f) | | | — | | | | — | |
| |
Liability amount | | | — | | | | 107 | |
Less: current portion | | | — | | | | (107 | ) |
| |
| | | | | | | | |
Rand Merchant Bank (g) | | | — | | | | — | |
| |
Liability amount | | | — | | | | 78 | |
Less: current portion | | | — | | | | (78 | ) |
| |
| | | | | | | | |
Rand Merchant Bank (h) | | | — | | | | — | |
| |
Liability amount | | | — | | | | 71 | |
Less: current portion | | | — | | | | (71 | ) |
| |
F-45
| | | | | | | | | |
| | | US Dollar | |
| |
| Figures in million | | 2008 | | | 2007 | |
| |
| | | | | | | | |
Westpac Bank (i) | | | 27 | | | | — | |
| |
Liability amount | | | 33 | | | | — | |
Less: current portion | | | (6 | ) | | | — | |
| |
| | | | | | | | |
Nedbank Limited (j) | | | — | | | | — | |
| |
Principal amount | | | 256 | | | | — | |
Less: amortized issue costs | | | (1 | ) | | | — | |
| |
| | | 255 | | | | — | |
Less: current portion | | | (255 | ) | | | — | |
| |
| | | | | | | | |
| |
Total uncollateralized long-term borrowings | | | 27 | | | | 24 | |
| |
| | | | | | | | |
Total long-term borrowings | | | 31 | | | | 248 | |
Total current portion of borrowings | | | 494 | | | | 405 | |
| |
Total borrowings | | | 525 | | | | 653 | |
| |
| | |
| (a) | | On May 21, 2004, Harmony issued an international uncollateralized fixed rate convertible bondin an aggregate principal amount of US$251.9 million. Interest at a rate of 4.875% per annum ispayable semi-annually in arrears on May 21 and November 21 of each year, commencing November 21,2004. The bonds mature five years from the issue date at their nominal value of US$218 millionunless converted into the Company’s ordinary shares. The bonds are convertible at the option ofthe bondholders at any time on or after July 1, 2004 and up to and including May 15, 2009, unlesspreviously redeemed, converted or purchased and cancelled, into fully paid ordinary shares. Thenumber of ordinary shares to be issued at such a conversion shall be determined by dividing theprincipal amount of each bond by the conversion price in effect on the relevant conversion date.The initial conversion price is R121 (US$15.51) per ordinary share subject to certain standardanti-dilutive provisions such as a rights offering, that are designed to maintain the value of theconversion option. The fair values of the liability component and the equity conversion componentwere determined on the issue of the bond. The fair value of the liability component, included inlong term borrowings, was calculated using a market interest rate for an equivalentnon-convertible bond (10%). |
| |
| | | The residual amount, representing the value of the equity conversion component, is includedin other reserves net of deferred taxes. In subsequent periods, the liability component continuesto be presented on the amortized cost basis, until extinguished on conversion or maturity of thebonds. The equity conversion component is determined on the issue of the bonds and is not changedin subsequent periods. The bonds are listed on the London Stock Exchange for Bonds. The terms andconditions of the bonds prohibit Harmony and its material subsidiaries from creating anyencumbrance or security interest over any of its assets to secure any relevant debt (defined asbonds, notes, debentures, loan stock or other securities which are tradable on a securitiesmarket) without according the same security to the bondholders or without obtaining the priorapproval of the bondholders. Included in the amortization charge as per the income statement isUS$1.2 million (2007: US$1.2 million) for amortization of the bond issue costs. |
| |
| (b) | | The loan to Africa Vanguard Resources (Doornkop) (Proprietary) Limited (“AVRD”) from itsholding company African Vanguard Resources (Proprietary) Limited remained unchanged from theprevious year. In 2005 AVRD borrowed an additional R18 million (US$2.3 million) to service workingcapital commitments. This increased the initialloan of US$1.8 million to US$4.1 million. The loan is unsecured and interest free, with no fixedterms of repayment over the short term. Refer to note 28 (c). |
| |
| (c) | | On July 30, 2003, AVRD entered into a term loan facility of US$19.1 million with NedbankLimited for the purpose of partially funding AVRD’s purchase of an undivided 26% share of theMining titles, to be contributed to the Doornkop South Reef project. Interest at a variable rateequal to JIBAR plus 2% shall be repayable to the extent that AVRD received a portion of the profitfrom the project. Unpaid interest shall be capitalized and repaid with the loan amount. The loanamount and any interest accrued is repayable on July 30, 2008. Interest capitalized during theyear ended June 30, 2008 amounted to US$4.1 million (2007: US$2.2 million). |
| |
| | | The facility from Nedbank to AVRD is guaranteed by Harmony and certain of its subsidiaries.As a result of this guarantee and other factors, the Group is required to consolidate AVRD and hastherefore included the loans from Nedbank and Africa Vanguard Resources (Proprietary) Limited inits consolidated borrowings. |
| |
| (d) | | On April 15, 2005, the ARM Trust entered into a term loan facility ofUS$75.4 million with Nedbank for the purpose of funding thebalance of the ARM Trust’sacquisition of the shares the Group held in ARM. The loan bears interest, compounded monthly, at arate of JIBAR plus 1.5% per annum. Interest capitalized during the year ended June 30, 2008amounted to US$2.5 million (2007: US$8.6 million) (refer to note 12). On September 28, 2007, theARM Trust guarantee was cancelled by Nedbank and consequently Harmony has no further obligation toNedbank in this regard. The ARM investment and associated Nedbank loans was deconsolidated fromthis date. Refer to note 19 (f). |
F-46
| | |
| (e) | | On April 15, 2005, the ARM Trust entered into a second term loan facility of US$56.7 million withNedbank for the purpose of funding the ARM Trust’s partial acquisition of the shares theCompany held in ARM (Refer note 19 (f)). The loan bears interest, compounded monthly, at a rate ofJIBAR plus 1.5% per annum. Interest capitalized during the year ended June 30, 2008 amounted toUS$2.1 million (2007: US$6.8 million) (refer to note 12). The loan is repayable on the 5thanniversary of the advance date. On September 28, 2007, the loan was consolidated as per note 28(d). |
| |
| (f) | | During March 2007, the Group entered into a financing agreement with RMB. In terms of thefinancing agreement, 5,747,000 Gold Fields ordinary shares were pledged as collateral. Thefinancing amounted to US$103.4 million. Of this amount, US$82.3 million was used to repay aportion of the term loan obtained in March 2006. |
| |
| | | Interest is payable to RMB at a rate equal to the SAFEX Financial Derivatives overnightdeposit rate (SAFEX overnight rate) plus 35 basis points. |
| |
| | | The Group placed a 20% deposit of the notional amount with RMB in an initial margin accountfor any change in the Gold Fields share price below the reference price of R130.88 (US$17.81) pershare. Interest is payable by RMB to the Group at the SAFEX overnight rate less 15 basis points. |
| |
| | | On August 24, 2007, the Group entered into an agreement to sell its Gold Fields ordinaryshares for a consideration of US$185 million. The proceeds were used to settle the Randfonteinredeemable preference shares issued to RMB in April 2007, as well as the financing arranged withRMB in March 2007. Refer to note 28 (g). |
| |
| (g) | | During April 2007, Randfontein Estates Limited (“Randfontein”) (a wholly owned subsidiary ofHarmony) issued 55,000,000 cumulative, floating rate, redeemable preference shares to RMB forUS$75.4 million. US$54.9 million of the consideration was used to repay a portion of the term loanobtained in March 2006. The obligation to redeem the preference shares is secured by the cessionof shares in Gold Fields in a ratio of 1.5:1. |
| |
| | | The preference shares are redeemable on the date that falls three years and a day after theissue date, but may be redeemed by Randfontein at any time before this date . The amount to beredeemed is the issue price together with any accumulated dividends and dividends that have beendeclared but not paid. |
| |
| | | The first dividend date is March 1, 2008. The dividend rate is variable and is set out asfollows: |
| |
| | | - for the period from the issue date until August 31, 2007, the variable dividend rate isequal to 35% of the prime rate; |
| |
| | | - for the period from September 1, 2007 until February 29, 2008, the variable dividend rateis equal to 50% of the prime rate; |
| |
| | | - on March 1, 2008, the variable dividend rate is equal to 83% of the prime rate. |
| |
| | | In August 2007, the preference shares were redeemed as per note 28 (f). |
| |
| (h) | | On June 29, 2007, RMB advanced US$68.6 million in terms of a short term bridging loan. Theloan became due on July 31, 2007 along with interest, calculated at the rate equal to the SAFEXovernight rate plus 2.4%. In the event that Harmony elected to extend the loan facility untilSeptember 30, 2007, the interest would be calculated at the rate equal to the SAFEX overnight rateplus 3.6% during the extension period. |
| |
| | | On September 29, 2007, the short term bridging loan fromRMB was repaid. Refer to note 28 (j)for details on the funds utilized. |
| |
| (i) | | During July 2007, Morobe Consolidated Goldfields entered into a finance lease agreement withWestpac Bank for the purchase of mining fleet to be used on the Hidden Valley project. |
| |
| | | Interest is charged at US — LIBOR plus 1.25% per annum. Interest is accrued monthly and leaseinstallments are repayable quarterly terminating June 30, 2013. The mining fleet financed is usedas security for these loans. |
| | | | | | | | | |
| | | US Dollar | |
| Figures in million | | 2008 | | | 2007 | |
| |
| | | | | | | | |
The future minimum lease payments are as follows: | | | | | | | | |
| | | | | | | | |
Due within one year | | | 7 | | | | — | |
Due between one and two years | | | 7 | | | | — | |
Due between two and five years | | | 23 | | | | — | |
| |
| | | 37 | | | | — | |
Future finance charges | | | (4 | ) | | | — | |
| |
| | | 33 | | | | — | |
| |
| | |
| (j) | | On September 28, 2007, Harmony entered into a term loan facility of US$283.9 million withNedbank, for the purpose of partially funding capital expenditure in respect of projects,as well as to repay the short term bridging loan amounting to US$68.6 million (refer to note 28(h)). Interest accrues on a day to day basis over the term of theloan at a variable interest |
F-47
| | |
| | | rate, which is fixed for three month periods, equal to the JIBAR plus 2.75% plus banking costs. The loan isrepayable on December 29, 2008 and interest is repayable every quarter commencing on September 28,2007. |
The exposure of the Group’s borrowings to changes in interest rate and contractual repricingis as following:
| | | | | | | | | |
| | | US Dollar | |
| Figures in million | | 2008 | | | 2007 | |
| |
| | | | | | | | |
Variable rate | | | 27 | | | | 24 | |
Current | | | 494 | | | | 405 | |
Between 1 to 2 years | | | — | | | | 219 | |
Between 2 to 5 years | | | — | | | | — | |
Over 5 years | | | 4 | | | | 5 | |
| |
Total borrowings | | | 525 | | | | 653 | |
| |
| | | | | | | | |
Variable rate | | | 5.1 | % | | | 3.7 | % |
Current | | | 94.1 | % | | | 62.1 | % |
Between 1 to 2 years | | | 0.0 | % | | | 33.5 | % |
Between 2 to 5 years | | | 0.0 | % | | | 0.0 | % |
Over 5 years | | | 0.8 | % | | | 0.7 | % |
| |
Total borrowings | | | 100.0 | % | | | 100.0 | % |
| |
| | | | | | | | |
The maturity of borrowings is as follows: | | | | | | | | |
| | | | | | | | |
Current | | | 494 | | | | 405 | |
Between 1 to 2 years | | | 6 | | | | 243 | |
Between 2 to 5 years | | | 21 | | | | — | |
Over 5 years | | | 4 | | | | 5 | |
| |
Total borrowings | | | 525 | | | | 653 | |
| |
| | | | | | | | | |
| | | 2008 | | 2007 |
| |
| | | | | | | | |
Convertible unsecured fixed rate bonds (a) | | | 10.0 | % | | | 10.0 | % |
Africa Vanguard Resources (Proprietary) Limited (b) | | | 0.0 | % | | | 0.0 | % |
Nedbank Limited (c) | | | 13.4 | % | | | 11.9 | % |
Nedbank Limited (d)* | | | 0.0 | % | | | 9.5 | % |
Nedbank Limited (e)* | | | 0.0 | % | | | 10.0 | % |
Rand Merchant Bank (f)* | | | 0.0 | % | | | 9.4 | % |
Rand Merchant Bank (g)* | | | 0.0 | % | | | 4.6 | % |
Rand Merchant Bank (h)* | | | 0.0 | % | | | 12.7 | % |
Westpac Bank (i) | | | 4.1 | % | | | 0.0 | % |
Nedbank Limited (j) | | | 14.5 | % | | | 0.0 | % |
The level of Harmony’s borrowing powers, as determined by its Articles of Association, shallnot except with the consent Harmony’s general meeting, exceed the aggregate from time to time ofthe issued and paid-up share capital ofthe Company, together with the aggregate of the amounts standing to the credit of alldistributable and non-distributable reserves (including non-controlling interests in subsidiarycompanies and provisions for deferred taxation) and any share premium accounts of the Company andits subsidiaries. At year end, total borrowings amounted to US$525 million (2007: US$652 million).
F-48
| 29 | | Provision for environmental rehabilitation |
The Group’s mining and exploration activities are subject to extensive environmental laws andregulations. These laws and regulations are continually changing and are generally becoming morerestrictive. The Group has made, and expects to make in the future, expenditures to comply withsuch laws and regulations, but cannot predict the full amount of such future expenditures.Estimated future reclamation costs are based principally on legal and regulatory requirements. Thefollowing is a reconciliation of the total liability for environmental rehabilitation:
| | | | | | | | | |
| | | US Dollar | |
| |
| Figures in million | | 2008 | | | 2007 | |
| |
| | | | | | | | |
Provision raised for future rehabilitation | | | | | | | | |
| | | | | | | | |
Opening balance | | | 192 | | | | 120 | |
Disposal of assets | | | (16 | ) | | | (4 | ) |
Change in estimate — Balance sheet | | | 12 | | | | 53 | |
Change in estimate — Income statement | | | 1 | | | | (1 | ) |
Inflation present value adjustment and time value of money component | | | 22 | | | | 17 | |
Foreign currency translation adjustments | | | (15 | ) | | | 7 | |
| |
Closing balance | | | 196 | | | | 192 | |
Provision associated with non-current assets held for sale | | | (51 | ) | | | (36 | ) |
| |
| | | 145 | | | | 156 | |
| |
While the ultimate amount of rehabilitation costs to be incurred in the future is uncertain, theGroup has estimated that, based on current environmental and regulatory requirements, the totalcost for the mines, in current monetary terms, is approximately US$269 million (2007: US$276million). Refer to note 3.4 for the estimations and judgments used in the calculations.
Included in the charge to the income statement is an amount US$6 million (2007: US$9 million)relating to the time value of money.
| | | | | | | | | |
| Future net obligations | | | | | | | | |
| | | | | | | | |
Ultimate estimated rehabilitation cost | | | 269 | | | | 276 | |
Amountsinvested in Environmental trust funds (note 18)* | | | (206 | ) | | | (198 | ) |
| |
Total future obligations | | | 63 | | | | 78 | |
| |
The Group intends to finance the ultimate rehabilitation costs from the money invested withenvironmental trust funds, ongoing contributions, as well as the proceeds on sale of assets andgold from plant clean-up at the time of mine closure.
| * | | This includes amounts related to non-current assets held for sale. |
| 30 | | Provision for other liabilities and charges |
| | | | | | | | | |
| | | US Dollar | |
| |
| Figures in million | | 2008 | | | 2007 | |
| |
| | | | | | | | |
Non-current | | | | | | | | |
Retirement benefit obligation (Refer to note 33) | | | 17 | | | | 15 | |
Other | | | 1 | | | | 3 | |
| |
Closing balance | | | 18 | | | | 18 | |
| |
F-49
| 31 | | Trade and other payables |
| | | | | | | | | |
| | | US Dollar | |
| |
| Figures in million | | 2008 | | | 2007 | |
| |
| | | | | | | | |
Financial liabilities | | | | | | | | |
Trade payables | | | 86 | | | | 88 | |
Other liabilities | | | 8 | | | | 8 | |
Non-financial liabilities | | | | | | | | |
Payroll accruals | | | 37 | | | | 65 | |
Leave liabilities | | | 27 | | | | 34 | |
Shaft related accruals | | | 16 | | | | 17 | |
Other accruals | | | 21 | | | | 21 | |
Value added tax | | | 6 | | | | 17 | |
Taxation | | | 12 | | | | 7 | |
| |
Total trade and other payables | | | 213 | | | | 257 | |
| |
Employee entitlements to annual leave are recognized on an ongoing basis. An accrual is made forthe estimated liability for annual leave as a result of services rendered by employees up to thebalance sheet date. The movement in the liability recognized in the balance sheet is as follows:
| | | | | | | | | |
| | | US Dollar | |
| |
| Figures in million | | 2008 | | | 2007 | |
| |
| | | | | | | | |
At the beginning of the year | | | 36 | | | | 31 | |
Benefits paid | | | (38 | ) | | | (26 | ) |
Foreign currency translation adjustments | | | (1 | ) | | | — | |
Total expense per income statement | | | 32 | | | | 31 | |
| |
| | | 29 | | | | 36 | |
Reclassified as non-current assets held for sale | | | (2 | ) | | | (2 | ) |
| |
At the end of the year | | | 27 | | | | 34 | |
| |
| 32 | | Cash generated by operations |
The following represents a reconciliation of profit/(loss) before taxation to cash generated by operations from continuing and discontinued operations. Details regardingcash flows from discontinued operations are presented in note 14.
| | | | | | | | | | | | | |
| | | US Dollar | |
| |
| Figures in million | | 2008 | | | 2007 | | | 2006 | |
| |
| | | | | | | | |
Profit/(loss) before taxation | | | 33 | | | | 90 | | | | (58 | ) |
Adjustments for: | | | | | | | | | | | | |
Amortization and depreciation | | | 123 | | | | 163 | | | | 171 | |
Impairment/(reversal of impairment) of assets | | | 36 | | | | 38 | | | | (30 | ) |
Loss/(gain) on financial instruments | | | 1 | | | | (6 | ) | | | 82 | |
Profit on sale of mining assets | | | (15 | ) | | | (25 | ) | | | (10 | ) |
Net increase/(decrease) in provision for post retirement benefits | | | 1 | | | | (2 | ) | | | 1 | |
Net increase/(decrease) in provision for environmental rehabilitation | | | 2 | | | | (1 | ) | | | (3 | ) |
Loss from associates | | | 11 | | | | 3 | | | | 17 | |
Impairment of investment in associate | | | 12 | | | | — | | | | — | |
Share-based payments | | | 6 | | | | 6 | | | | 16 | |
Fair value of non-derivative financial instrument | | | (4 | ) | | | (15 | ) | | | (14 | ) |
Loss/(profit) on sale of listed investments | | | 63 | | | | 3 | | | | (45 | ) |
Profit on sale of subsidiary | | | — | | | | — | | | | (2 | ) |
Profit on sale of investment in associate | | | — | | | | (33 | ) | | | — | |
Dividends received | | | (5 | ) | | | (3 | ) | | | (3 | ) |
Interest received | | | (38 | ) | | | (25 | ) | | | (33 | ) |
Interest paid — cash | | | 57 | | | | 31 | | | | 32 | |
Interest paid — non cash | | | 19 | | | | 35 | | | | 39 | |
Cost on closure of hedge positions | | | — | | | | (80 | ) | | | (54 | ) |
Other non cash transactions | | | — | | | | (15 | ) | | | (14 | ) |
F-50
| | | | | | | | | | | | | |
| | | US Dollar | |
| |
| Figures in million | | 2008 | | | 2007 | | | 2006 | |
| |
| | | | | | | | |
Effect of changes in operating working capital items: | | | | | | | | | | | | |
Receivables | | | 4 | | | | (27 | ) | | | (9 | ) |
Inventories | | | 7 | | | | (30 | ) | | | (6 | ) |
Accounts payable and accrued liabilities | | | (45 | ) | | | 57 | | | | (24 | ) |
| |
Cash generated by operations | | | 268 | | | | 164 | | | | 53 | |
| |
Additional cash flow information
The income and mining taxes paid in the statement of cash flow represents actual cash paid.
Acquisitions and disposals of Subsidiaries / Businesses:
| | | | | |
| | | US Dollar | |
| |
| Figures in million | | 2008 | |
| |
| | | | |
For the year ended June 2008 | | | | |
| | | | |
On December 6, 2007, the Group disposed of its assets and liabilities in South Kal Mine to Dioro. The aggregate fair value of the assets and liabilities sold were: | | | | |
Property, plant and equipment | | | 50 | |
Consumables | | | 3 | |
Shares | | | 3 | |
Rehabilitation liability | | | (8 | ) |
Loss on disposal | | | (12 | ) |
| |
Disposal proceeds | | | 36 | |
Proceeds received by way of shares | | | (18 | ) |
| |
Proceeds received in cash | | | 18 | |
| |
| | | | |
| | | | |
On February 27, 2008, the Group disposed of its assets and liabilities in its Orkney operations to Pamodzi. The aggregate fair value of assets and liabilities soldwere: | | | | |
Property, plant and equipment | | | 38 | |
Rehabilitation trust fund | | | 4 | |
Leave liability | | | (2 | ) |
Provision for environmental rehabilitation liability | | | (7 | ) |
Profit on disposal | | | 13 | |
| |
Disposal proceeds | | | 46 | |
Proceeds received by way of shares | | | (46 | ) |
| |
Cash and cash equivalent at disposal | | | — | |
| |
The principal non-cash transactions for the year were the acquisition of the PNG royaltyagreement (refer note 16), share based payments (refer note 35) and the purchase of assets underfinance lease (refer notes 16 and 28).
| | | | | |
| | | US Dollar | |
| |
| Figures in million | | 2007 | |
| |
| | | | |
For the year ended June 2007 | | | | |
| | | | |
On May 28, 2007, the Group disposed of 17% of its 50% share in Orpheo to AngloGold Ashanti Limited. The aggregate fair value of the assets acquired and liabilities assumed, andsubsequently disposed of, were : | | | | |
| | | | |
Inventories | | | — | |
Property, plant and equipment | | | 1 | |
Investment in associate | | | (1 | ) |
Accounts payable and accrued liabilities | | | — | |
| |
Total purchase price | | | — | |
Proceeds received by way of accounts receivable | | | — | |
| |
Cash and cash equivalents at disposal | | | — | |
| |
The principal non-cash transactions for the year were the share-based payments (refer note 35)and the disposal of the investment in associate in Western Areas (refer note 8).
F-51
| | | | | |
| | | US Dollar | |
| |
| Figures in million | | 2006 | |
| |
| | | | |
For the year ended June 2006 | | | | |
| | | | |
On July 1, 2005, the Group acquired a 50% share in Orpheo. The aggregate fair value of the assets acquired and liabilities assumed were: | | | | |
| | | | |
Inventories | | | — | |
Property, plant and equipment | | | 1 | |
Accounts payable and accrued liabilities | | | — | |
| |
Total purchase price | | | 1 | |
Paid for by way of accounts payable | | | (1 | ) |
| |
Cash and cash equivalents at acquisition | | | — | |
| |
| | | | |
On December 20, 2005, the Group acquired a 45% share in MP Britz and H. Taute Pharmacies through its joint venture agreement with Healthshare. The aggregatefair value of the assets acquired and liabilities assumed were: | | | | |
Inventories | | | — | |
Accounts receivable | | | — | |
Property, plant and equipment | | | — | |
Intangible assets | | | 1 | |
Accounts payable and accrued liabilities | | | (1 | ) |
| |
Total purchase price | | | — | |
Paid for by way of accounts payable | | | — | |
| |
Cash and cash equivalents at acquisition | | | — | |
| |
| | | | |
On March 31, 2006, the Group disposed of its shareholding in Buffalo Creek. The aggregate fair value of the assets and liabilities sold were: | | | | |
Inventories | | | — | |
Property, plant and equipment | | | 18 | |
Deferred tax | | | (3 | ) |
Provision for rehabilitation liability | | | — | |
Accounts payable and accrued liabilities | | | — | |
Foreign exchange | | | — | |
Profit on disposal sale of subsidiary | | | 2 | |
| |
Disposal proceeds | | | 17 | |
Proceeds received by way of accounts receivable | | | (10 | ) |
Proceeds received by way of shares | | | (4 | ) |
| |
Proceeds received by way of cash | | | 3 | |
| |
The principal non-cash transactions for the year were the share-based payments (refer note35).
| 33 | | Retirement benefit obligations |
Pensionand provident funds: The Group contributes to several pension and provident funds governed by the Pension Funds Act, 1956 for the employees of its South African operations. The pension funds are multi-employer industry plans. TheGroup’s liability is limited to its annually determined contributions.
The provident funds are funded on the “money accumulative basis” with the member’s and employer’s contributions having been fixed in the constitution ofthe funds.
The Australian group companies make contributions to each employee’s Superannuation (pension)funds in accordance with the Superannuation Guarantee Scheme (SGS). The SGS is a Federal Governmentinitiative enforced by law which compels employers to make regular payments to regulated fundsproviding for each employee on their retirement. The SGS were set at a minimum of 9% of grosssalary and wages for the 2008 year (2006 and 2007: 9%).
Substantially all the Group’s employees are covered by the above mentioned retirement benefitplans. Funds contributed by the Group for the 2008 financial year amounted to US$46.5 million(2007: US$41.8 million) (2006: US$47.3 million).
F-52
Post-retirement benefits other than pension: Most of the supervisory and managerial workers in South Africa participate in the Minemed medical scheme, as wellas other medical schemes. The Group contributes to these schemes on behalf of current employees and retired employees who retired prior to December 31, 1996 (Minemed scheme). The annual contributions for these retired employeesare fixed. The Group’s contributions to these schemes on behalf of current employees amounted to US$9.8 million for 2008, US$8.9 million for 2007 and US$13.0 million for 2006.
With the exception of some Freegold employees included from date of acquisition, no post-retirement benefits are available to other current workers. No liability exists foremployees who were members of these schemes who retired after the date noted above. The medical schemes pay certain medical expenses for both current and retired employees and their dependents. Current and retiredemployees pay an annual fixed contribution to these schemes.
Assumptions used to determine the liability relating to the Minemed medical scheme included, a discount rate of 12%, no increases in employer subsidies (in terms of theagreement) and mortality rates according to the SA“amf” tables and a medical inflation rate of 9.80%. It is also assumed thatall members will retire at the age of 60 and will remain on the current benefit option.
The liability is based on an actuarial valuation conducted during the year ended June 30, 2008, using the projected unit credit method. The next actuarial valuationwill be performed on June 30, 2009.
| | | | | | | | | |
| | | US Dollar | |
| |
| Figures in million | | 2008 | | | 2007 | |
| |
| | | | | | | | |
Present value of unfunded obligations | | | 17 | | | | 15 | |
| |
| | | | | | | | |
Movement in the liability recognized in the balance sheet | | | | | | | | |
| | | | | | | | |
Opening balance as previously stated | | | 15 | | | | 15 | |
Contributions paid | | | — | | | | — | |
Other expenses included in staff costs/current service cost | | | 1 | | | | 1 | |
Interest cost | | | 1 | | | | 1 | |
Net actuarial loss/(gains) recognized during the year | | | 2 | | | | (2 | ) |
Foreign currency translation reserve | | | (2 | ) | | | — | |
| |
Balance at the end of the year | | | 17 | | | | 15 | |
| |
| | | | | | | | |
The principal actuarial assumptions used for accounting purposes were: | | | | | | | | |
| | | | | | | | |
Discount rate | | | 12.0 | % | | | 9.0 | % |
Healthcare inflation rate | | | 9.8 | % | | | 6.3 | % |
Normal retirement age | | | 60 | | | | 60 | |
| |
| | | | | | | | |
The history of the defined benefit plan is as follows: | | | | | | | | |
| | | | | | | | |
Present value of defined benefit obligation | | | 17 | | | | 15 | |
Fair value of plan assets | | | — | | | | — | |
| |
Net liability | | | 17 | | | | 15 | |
| |
The present value of defined benefit obligation was US$14.9 million in 2006, US$13.3 million in 2005 and US$1.6 million in 2004.
The effect of a one percentage point increase (and decrease) in the assumed medical cost trend rates for 2008 is as follows:
| | | | | | | | | |
| | | US Dollar | |
| |
| Figures in million | | 2008 | | | 2007 | |
| |
| | | 1% | | | 1% | |
| | | Increase / | | | Increase / | |
| | decrease | | | decrease | |
| |
| | | | | | | | |
Effect on: | | | | | | | | |
Aggregate of service cost and interest cost | | | — | | | | — | |
Defined benefit obligation | | | 3 | | | | 3 | |
| |
The Group expects to contribute approximately US$0.4 million to its benefit plan in 2009.
F-53
| | | | | | | | | |
| Number of permanent employees as at June 30: | | 2008 | | | 2007 | |
| |
| | | | | | | | |
South Africa operations* | | | 36,839 | | | | 41,118 | |
International operations** | | | 871 | | | | 466 | |
| |
Total | | | 37,710 | | | | 41,584 | |
| |
| | | | | | | | | |
| | | US Dollar | |
| |
| Figures in million | | 2008 | | | 2007 | |
| |
| | | | | | | | |
Aggregate earnings: | | | | | | | | |
The aggregate earnings of employees including directors were: | | | | | | | | |
Salaries and wages and other benefits | | | 584 | | | | 432 | |
Retirement benefit costs | | | 47 | | | | 42 | |
Medical aid contributions | | | 10 | | | | 9 | |
| |
Total aggregate earnings | | | 641 | | | | 483 | |
| |
Directors’ remuneration
Duringthe fiscal 2008, the directors received remuneration of US$1.2 million, comprising of US$0.4 million for salaries, US$0.5 million for retirementcontributions and US$0.3 million for bonuses. The non-executive directors received US$0.3 million in directors’ fees. The aggregate of remuneration received by senior management was US$2.7 million.
Duringthe fiscal 2007, the directors received remuneration of US$0.8 million, comprising of US$0.7 million for salaries and US$0.1 million for retirementcontributions. The non-executive directors received US$0.3 million in directors’ fees. The aggregate of remuneration received by senior management was US$5.9 million.
| | |
| * | | The employees attributable to the discontinued operations were 3 618 (2007: 6 313). |
| |
| ** | | The total employees at Australian operations at 30 June 2008 was 873 (2007: 695). Of this total, 2 employees (2007: 229) were attributable to the discontinued operations. |
The Group currently has the 2001, 2003 schemes and the 2006 share plan that are still active. The objective of these schemes is to recognize the contributions of seniorstaff to the Group’s financial position and performance and to retain key employees.
The options granted under the 2001 and 2003 schemes
A fifth of the options granted under the 2001 and 2003 schemes are exercisable annually from the grant date with an expire date of 10 years from the grant date. Theoffer price of these options equaled the closing market price of the underlying shares on the trading date immediately preceding the granting of the options.
On resignation and retirement, share options which have not yet vested will lapse and share options which have vested may be taken up at the employee’s election beforethe last day of service. Payment of shares forfeited will therefore not be required. On death, all options vest immediately and the deceased estate has a period of twelve months to exercise these options.
Following the introduction of the 2006 share plan, no further options are expected to be allocated under these two schemes.
| | | | | | | | | |
| Number of share options relating to the 2001 and 2003 option schemes | | 2008 | | | 2007 | |
| |
| | | | | | | | |
Share options granted | | | 28,442,420 | | | | 28,442,420 | |
| |
Exercised | | | 17,249,668 | | | | 15,485,536 | |
Vested but not exercised | | | 1,792,796 | | | | 1,843,156 | |
Unvested | | | 2,735,443 | | | | 6,286,513 | |
Forfeited and lapsed | | | 6,664,513 | | | | 4,827,215 | |
| |
| | | | | | | | |
Vesting periods of unvested options: | | | | | | | | |
| | | | | | | | |
Within one year | | | 1,367,722 | | | | 2,186,819 | |
One to two years | | | 1,367,721 | | | | 2,049,847 | |
Two to three years | | | — | | | | 2,049,847 | |
| |
Total number of unvested options | | | 2,735,443 | | | | 6,286,513 | |
| |
F-54
There was no movement on options granted regarding the 2001 and 2003 option schemes.
| | | | | | | | | |
| | | | | | | Weighted average | |
| | | | | | | option price | |
| Activity on share options granted but not yet exercised | | Shares | | | (Rand) | |
| |
| | | | | | | | |
For the year ended June 30, 2007 | | | | | | | | |
| | | | | | | | |
Balance at beginning of year | | | 12,543,207 | | | | 49.38 | |
Options exercised | | | (2,627,249 | ) | | | 51.82 | |
Options forfeited and lapsed | | | (1,786,289 | ) | | | 50.37 | |
| |
Closing balance | | | 8,129,669 | | | | 48.38 | |
| |
| | | | | | | | |
For the year ended June 30, 2008 | | | | | | | | |
| | | | | | | | |
Balance at beginning of year | | | 8,129,669 | | | | 48.38 | |
Options exercised | | | (1,764,132 | ) | | | 49.16 | |
Options forfeited and lapsed | | | (1,837,298 | ) | | | 45.77 | |
| |
Closing balance | | | 4,528,239 | | | | 49.14 | |
| |
| | | | | | | | | | | | | |
| | | At June 30, | | | Option price | | | Remaining life | |
| List of options granted but not yet exercised (listed by grant date) | | 2008 | | | (Rand) | | | (years) | |
| |
| | | | | | | | | | | | |
April 24, 2001 | | | 21,000 | | | | 36.50 | | | | 2.8 | |
November 20, 2001 | | | 221,260 | | | | 49.60 | | | | 3.4 | |
September 23, 2002 | | | 33,768 | | | | 66.00 | | | | 4.2 | |
March 27, 2003 | | | 261,000 | | | | 91.60 | | | | 4.7 | |
August 10, 2004 | | | 1,066,713 | | | | 66.15 | | | | 6.1 | |
April 26, 2005 | | | 2,924,498 | | | | 39.00 | | | | 6.8 | |
| |
Total option granted but not yet exercised | | | 4,528,239 | | | | | | | | | |
| |
The number of shares held by the Harmony Share Trust at year end amounted to 107 400 (2007: 109 400). This trust is considered to be an SPE and is therefore consolidated inaccordance with the Group’s accounting policies.
| | | | | | | | | |
| List of options granted but not yet vested (listed by grant date) | | 2008 | | | 2007 | |
| |
| | | | | | | | |
September 23, 2002 | | | — | | | | 35,371 | |
March 27, 2003 | | | — | | | | 101,600 | |
August 10, 2004 | | | 817,660 | | | | 1,763,665 | |
April 26, 2005 | | | 1,917,783 | | | | 4,385,877 | |
| |
Total options granted but not yet vested | | | 2,735,443 | | | | 6,286,513 | |
| |
| | | | | | | | | |
| | | US Dollar | |
| |
| Figures in million | | 2008 | | | 2007 | |
| |
| | | | | | | | |
Average market price of options traded during the year | | | 22 | | | | 40 | |
| |
| | | | | | | | |
Average fair value of share options vested during the year | | | 41 | | | | 72 | |
| |
Share-based payments | | | — | | | | 5 | |
| |
| | | | | | | | | | | | | |
| | | Option allocation | |
| | | March 27, 2003 | | | August 10, 2004 | | | April 26, 2005 | |
| |
| | | | | | | | | | | | |
The share-based payments are calculated using the binominal valuation model based on the following assumptions at grant date: | | | | | | | | | | | | |
Price at date of grant (SA Rand per share) | | | 91.60 | | | | 66.15 | | | | 39.00 | |
Risk-free interest rate: | | | 11.6 | % | | | 9.9 | % | | | 8.4 | % |
Expected volatility: | | | 45.0 | % | | | 40.0 | % | | | 35.0 | % |
Expected dividend yield: | | | 0.0 | % | | | 0.0 | % | | | 0.0 | % |
Vesting period: | | 5 years | | 5 years | | 5 years |
F-55
Share-based payments are measured at the fair value of the equity instruments at the date of thegrant. The cost is expensed over the vesting period, based on the Group’s estimate of the optionsthat are expected to eventually vest.
The only vesting conditions for the 2001 and 2003 schemes is that the employees should be in theemployment of the Group.
The volatility measured at the standard deviation of expected share price returns were based onstatistical analysis of daily share prices over the last three years before grant date.
The shares granted under the 2006 share plan
The 2006 share plan consist of both performance shares (PS) and share appreciation rights (SARs).The PS will vest after three years from the grant date, if and to the extent that the performanceconditions have been satisfied. The SARs will vest in equal thirds in year 3, 4 and 5 after grantdate, subject to the performance conditions having been satisfied. The SARs have an expiry date of6 years from the grant date and the offer price equals the closing market price of the underlyingshares on the trading date immediately preceding the grant.
The aggregate number of shares which may be allocated to the share plan on any day, when added tothe total number of unexercised SARs, unvested performance shares, and restricted shares which havebeen allocated for SAR’s and PS, and any other employee share scheme operating by the Group, shallnot exceed 14% of the number of issued ordinary shares of the company from time to time. On June30, 2008, 1,512,101 PS and 3,164,619 SARs had been allocated to participating employees.
Termination of employees is based on “No Fault” and “Fault” definitions.
In the case of share appreciation rights, if employment is terminated for No Fault reasons, thenthe value of the appreciation in all unvested and un-exercised SARs is settled in shares or cash asat the date of termination of employment, after the deduction of any tax payable.
| | • | | First the maximum number conditionally awarded is pro-rated for the time period until thetermination date; |
| | • | | Then this adjusted number is reduced to a third on the assumption that Harmony’s performancewas a median one with one third vesting; |
| |
| | • | | And then settled in cash or shares after the deduction of any tax payable. |
In either case, if employment is terminated for Fault reasons, all unvested and un-exercisedSARs and all PS not yet vested are lapsed and cancelled.
| | | | | | | | | |
| Number of shares relating to the 2006 share plan at June 30 | | 2008 | | | 2007 | |
| |
Shares granted | | | 4,676,720 | | | | 1,481,107 | |
| |
Unvested | | | 4,236,938 | | | | 1,468,510 | |
| |
Performance shares | | | 1,341,444 | | | | 538,516 | |
Share appreciation rights | | | 2,895,494 | | | | 929,994 | |
| |
Shares forfeited | | | 439,782 | | | | 12,597 | |
| |
Performance shares | | | 170,658 | | | | — | |
Share appreciation rights | | | 269,124 | | | | 12,597 | |
| |
| | | | | | | | |
Vesting periods of unvested shares granted: | | | | | | | | |
One to two years | | | 603,399 | | | | — | |
Two to three years | | | 1,932,502 | | | | 848,514 | |
Three to four years | | | 965,165 | | | | 309,998 | |
Four to five years | | | 735,872 | | | | 309,998 | |
| |
Total number of unvested shares granted | | | 4,236,938 | | | | 1,468,510 | |
| |
F-56
| | | | | | | | | |
| | | | | | | Weighted average | |
| | | | | | | option price | |
| Activity on PS and SARs granted but not yet exercised | | Shares | | | (Rand) | |
| |
| | | | | | | | |
For the year ended June 30, 2007 | | | | | | | | |
| | | | | | | | |
Opening balance | | | — | | | | | |
| |
Performance shares | | | — | | | | n/a | |
Share appreciation rights | | | — | | | | — | |
| |
Options granted | | | 1,481,107 | | | | | |
| |
Performance shares | | | 538,516 | | | | n/a | |
Share appreciation rights | | | 942,591 | | | | 112.64 | |
| |
Options lapsed | | | (12,597 | ) | | | | |
| |
Performance shares | | | — | | | | n/a | |
Share appreciation rights | | | (12,597 | ) | | | 112.64 | |
| |
Closing balance | | | 1,468,510 | | | | | |
| |
Performance shares | | | 538,516 | | | | n/a | |
Share appreciation rights | | | 929,994 | | | | 112.64 | |
| |
| | | | | | | | |
For the year ended June 30, 2008 | | | | | | | | |
| | | | | | | | |
Opening balance | | | 1,468,510 | | | | | |
| |
Performance shares | | | 538,516 | | | | n/a | |
Share appreciation rights | | | 929,994 | | | | 112.64 | |
| |
Options granted | | | 3,195,613 | | | | | |
| |
Performance shares | | | 973,586 | | | | n/a | |
Share appreciation rights | | | 2,222,027 | | | | 71.19 | |
| |
Options lapsed | | | (427,185 | ) | | | | |
| |
Performance shares | | | (170,658 | ) | | | n/a | |
Share appreciation rights | | | (256,527 | ) | | | 110.27 | |
| |
Closing balance | | | 4,236,938 | | | | | |
| |
Performance shares | | | 1,341,444 | | | | n/a | |
Share appreciation rights | | | 2,895,494 | | | | 81.04 | |
| |
| | | | | | | | | | | | | |
| | | At June 30, | | | Strike price | | | Remaining life | |
| List of shares granted but not yet exercised (listed by grant date) | | 2008 | | | (Rand) | | | (years) | |
| |
| | | | | | | | | | | | |
Performance shares | | | | | | | | | | | | |
November 15, 2006 | | | 374,106 | | | | n/a | | | | 1.4 | |
November 15, 2007 | | | 955,030 | | | | n/a | | | | 2.4 | |
March 7, 2008 | | | 12,308 | | | | n/a | | | | 2.7 | |
| | | | | | | | | | | | |
Share appreciation rights | | | | | | | | | | | | |
November 15, 2006 | | | 687,880 | | | | 112.64 | | | | 4.4 | |
November 15, 2007 | | | 2,161,460 | | | | 70.54 | | | | 5.4 | |
March 7, 2008 | | | 46,154 | | | | 102.00 | | | | 5.7 | |
| |
Total option granted but not yet exercised | | | 4,236,938 | | | | | | | | | |
| |
None of the allocations for the 2006 share plan have vested yet.
| | | | | | | | | |
| | | US Dollar | |
| Figures in millions | | 2008 | | | 2007 | |
| |
| | | | | | | | |
Share-based payments | | | 5 | | | | 1 | |
| |
| | | | | | | | | |
| | | Performance | | | | |
| | | shares | | | SARs | |
| |
| | | | | | | | |
The share-based cost is calculated using the Monte Carlo simulation, based on the following assumptions at grant date. | | | | | | | | |
| | | | | | | | |
Price at date of grant (SA Rand per share) | | | | | | | | |
- November 15, 2006 share allocation | | | n/a | | | | 112.64 | |
- November 15, 2007 share allocation | | | n/a | | | | 70.54 | |
- March 7, 2008 share allocation | | | n/a | | | | 102.00 | |
Risk-free interest rate: | | | | | | | | |
- November 15, 2006 share allocation | | | 9.6 | % | | | 8.8 | % |
- November 15, 2007 share allocation (valuation date December 21, 2007) | | | 10.8 | % | | | 9.8 | % |
F-57
| | | | | | | | | |
| | | Performance | | | | |
| | | shares | | | SARs | |
| |
| |
- November 15, 2007 share allocation (valuation date April 21, 2008) | | | 11.7 | % | | | 10.7 | % |
- March 7, 2008 share allocation | | | 11.0 | % | | | 10.4 | % |
Expected volatility*: | | | | | | | | |
- November 15, 2006 share allocation | | | 34.7 | % | | | 26.4 | % |
- November 15, 2007 share allocation (valuation date December 21, 2007) | | | 46.3 | % | | | 35.1 | % |
- November 15, 2007 share allocation (valuation date April 21, 2008) | | | 49.5 | % | | | 41.7 | % |
- March 7, 2008 share allocation | | | 50.5 | % | | | 54.5 | % |
Expected dividend yield: | | | | | | | | |
- November 15, 2006 share allocation | | | 0.0 | % | | | 0.0 | % |
- November 15, 2007 share allocation (valuation date December 21, 2007) | | | 0.0 | % | | | 0.0 | % |
- November 15, 2007 share allocation (valuation date April 21, 2008) | | | 0.0 | % | | | 0.0 | % |
- March 7, 2008 share allocation | | | 0.0 | % | | | 0.0 | % |
Vesting period (from grant date): | | | | | | | | |
- November 15, 2006 share allocation | | 3 years | | 5 years |
- November 15, 2007 share allocation | | 3 years | | 5 years |
- March 7, 2008 share allocation | | 3 years | | 5 years |
Share-based payments are measured at the fair value of the equity instruments at the date of the grant.The cost is expensed over the vesting period, based on the Group’s estimate of the options that are expected to eventually vest.
The performance criteria imposed for the performance shares by the Board and which must be satisfied before settlement of any performanceshares are linked to the Company’s Total Shareholders Return (TSR) in comparison to the Philadelphia XAU index of international goldand precious metal mining companies (50%) and the JSE Gold Mining index (50%).
The following performance criteria was imposed per the Harmony (2006) Share Plan which must besatisfied before the settlement of any share appreciation rights:
| | • | | that the Group’s headline earnings per share have grown since the allocation date by a minimum of CPIX plus 3%; |
| |
| | • | | that the Group’s performance has since the allocation date been a satisfactory achievement in terms of the Company’ssustainability index. |
| | |
| * | | The volatility is measured as an annualized standard deviation of historical share price returns, using an exponentiallyweighted moving average (EWMA) model, with a lambda of 0.99. The volatility is calculated on the grant date, and takesinto account the previous three years of historical data. |
None of the directors or major shareholders of Harmony or, to the knowledge of Harmony,their families, had interest, direct or indirectly, in any transaction since July 1, 2005 orin any proposed transaction that has affected or will materially affect Harmony or its subsidiaries, other than as stated below.
Key management personnel are those persons having authority and responsibility for planning,directing and controlling the activities of the Group, directly or indirectly, including any director of the Group.Refer note 34 for details on the directors remuneration.
ARM currently holds 16% of Harmony’s shares. Patrice Motsepe,Andre Wilkens and Frank Abbott are directors of ARM.
On February 27, 2008, the Group sold its Orkney assets to Pamodzi in exchange for shares, wherebyit obtained an interest of 32.4% and Pamodzi became an associate (refer to note 20). Subsequent to this,Harmony provided goods and services to Pamodzi at cost plusan applicable margin as set out in the service level agreement. The balance of the uncollateralized loan atJune 30, 2008 was US$13.2 million. The terms of the loan are being renegotiated, with payment expected withintwo years. Interest is charged at prime rate;however should an event of default occur the rate will be prime plus 2% from then.
TheGroup sold its 45% joint venture in Healthshare on theJanuary 1, 2008 (refer to note 21).
| 37 | | Commitments and Contingencies |
| | | | | | | | | |
| | | US Dollar | |
| Figures in million | | 2008 | | | 2007 | |
| |
| | | | | | | | |
Capital expenditure commitments | | | | | | | | |
| | | | | | | | |
Contracts for capital expenditure | | | 149 | | | | 50 | |
Authorized by the directors but not contracted for | | | 221 | | | | 267 | |
| |
Total capital commitments | | | 370 | | | | 317 | |
| |
| | | | | | | | |
This expenditure will be financed from existing resources and where appropriate, borrowings. | | | | | | | | |
F-58
| | | | | | | | | |
| | | US Dollar | |
| Figures in million | | 2008 | | | 2007 | |
| |
Contingent liabilities | | | | | | | | |
Guarantees and suretyships | | | 2 | | | | 3 | |
Environmental guarantees | | | 22 | | | | 18 | |
| |
| | | 24 | | | | 21 | |
| |
On April 18, 2008, Harmony Gold Mining Company Limited was made aware that ithas been named or may be named as a defendant in a lawsuit filed in the U.S.District Court in the Southern District of New York on behalf of certainpurchasers and sellers of Harmony’s American Depository Receipts (“ADRs”).Harmony has retained legal counsel, who will advise Harmony on furtherdevelopments in the U.S. It is currently too early in the proceedings toestimate if there will be a financial effect, or what the effect might be.
F-59
| 38 | | Third year balance sheet |
As discussed in note 2.1, the Group adopted the requirements of IAS 23 (Revised) in the currentyear by retroactively adjusting prior year financial statements. The following represents theGroup’s balance sheet as at July 1, 2005 — the beginning of the earliest comparative period — inaccordance with the requirements on IAS 1 (Revised).
| | | | | |
| | | US Dollar | |
| Figures in million | | 2005 | |
| |
| | | | |
Assets | | | | |
| | | | |
Non-current assets | | | | |
Property, plant and equipment (a) | | | 3,385 | |
Intangible assets | | | 340 | |
Restricted cash | | | 8 | |
Restricted investments | | | 176 | |
Investments in financial assets | | | 448 | |
Deferred tax | | | 9 | |
| |
Total non-current assets | | | 4,366 | |
| |
| | | | |
Current assets | | | | |
Inventories | | | 87 | |
Trade and other receivables | | | 96 | |
Income and mining taxes | | | 4 | |
Cash and cash equivalents | | | 265 | |
| |
Total current assets | | | 452 | |
| |
Total assets | | | 4,818 | |
| |
| | | | |
Equity and liabilities | | | | |
| | | | |
Share capital and reserves | | | | |
Share capital | | | 3,700 | |
Other reserves | | | 135 | |
Accumulated loss | | | (346 | ) |
| |
Total equity | | | 3,489 | |
| |
| | | | |
Non-current liabilities | | | | |
Borrowings | | | 363 | |
Deferred tax (b) | | | 339 | |
Derivative financial instruments | | | 58 | |
Provision for environmental rehabilitation | | | 126 | |
Provisions for other liabilities and charges | | | 15 | |
| |
Total non-current liabilities | | | 901 | |
| |
| | | | |
Current liabilities | | | | |
Trade and other payables | | | 228 | |
Borrowings | | | 200 | |
| |
Total current liabilities | | | 428 | |
| |
Total equity and liabilities | | | 4,818 | |
| |
| | |
| (a) | | The opening balance of assets under construction (included in Property, Plant and Equipment)increased by US$5.8 million. The interest capitalized for 2005 amounted to US$3.4 million. |
| |
| (b) | | Deferred tax liability increased by US$1.7 million. |
Village Main Reef
On July 11, 2008, Harmony sold its 37.8% share in Village Main Reef Gold Mining Company (1934)Limited for R1.1 millionto To The Point Investments. Z B Swanepoel, Harmony’s previous Chief Executive Officer, is adirector and founder ofTo The Point Investments.
F-60
PNG Partnership agreement
On April 22, 2008 Morobe Consolidated Goldfields Limited and Wafi Mining Limited, subsidiaries ofHarmony Gold (Australia) (Proprietary) Limited entered into a Master Purchase and Farm-in Agreement with NewcrestMining Limited (“Newcrest”). This agreement provides for Newcrest to purchase a 30.01% ParticipatingInterest (Stage 1) and a further buy-out of an additional 19.99% Participating Interest inHarmony’s PNG gold and copper assets.
On July 16, 2008 the conditions precedent were finalized, which included regulatory and statutoryapprovals by the PNG Government. Stage 1 Completion has now taken place with an effective date ofJuly 31, 2008. Total consideration for Stage 1 completion of US$229 million was received duringAugust 2008, of which US$50 million has been placed in a jointly controlled Escrow account. Thisamount was subsequently released to Harmony following the confirmation of the approval of anexploration license during September 2008 by the PNG Mining Authorities.
Sale of Mount Magnet
Duringfiscal 2008, Harmony entered into an agreement with Monarch GoldMining Company (“Monarch”) for the sale of its Mount Magnetoperations. However, subsequent to year-end, Harmony was advised thatMonarch had placed itself in voluntary administration and, on August1, 2008, the Administrator indicated that Monarch will not proceedwith the proposed purchase and consequently the purchase agreementhas been terminated. Harmony received from Monarch a deposit of A$5million of which A$2.5 million has been refunded and A$2.5 millionhas been recorded as revenue. Harmony has resumed management of theoperation and also re-commenced the sale process. The assets are nowunder care and maintenance.
Theprice in the binding purchase agreement with Monarch, together withother competitive bids received at the time, was considered to be thebest evidence of the fair value less cost to sell of the Mount Magnetoperations at June 30, 2008. Due to the significantchanges in economic circumstances that occurred after July 1, 2008,including the availability and cost of funding to a potential buyer,management obtained an external indicative valuation in October 2008and updated their estimate of the fair value less costs to sell ofthe Mount Magnet operations. Based on these estimates, the fair valueless costs to sell decreased byapproximately US$18.3 million in the periodsubsequent to June 30, 2008. As a result, Harmony recognizedadditional impairments of its non-current assets held for sale in theSeptember 2008 quarter.
Sale of Randfontein’s Cooke assets
During December 2007, Harmony announced that its wholly owned subsidiary, RandfonteinEstates Limited (Randfontein) had entered into an agreement with Pamodzi ResourcesFund 1 LLP (“PRF”), in terms of which certain of Randfontein’s uranium and gold assetswould be sold into a company, Rand Uranium (Proprietary) Limited(“Rand Uranium”).
A revised purchase consideration of US$348 million has been agreed upon. We will receive US$209million for the sale of the 60% portion of Rand Uranium to PRF, US$40 million of which is payable on theeffective date (November 21, 2008), US$157 million, plus interest thereon at 5% per annum, on April22, 2009 and the balance of the purchase consideration on completion of stage two. Stage two ofthe transaction relates to the old Randfontein assets and is expected to be finalized on or shortly afterApril 22, 2009.
PRF’sinvestors, affliates of First Reserve Corporation and AMCI CapitalLP, have provided us with a guarantee inrespect of the above amounts. In addition, PRF will pledge its shares in Rand Uranium to us assecurity for PRF’s obligation to pay the purchase consideration.
The Group early adopted IFRS 8 — Operating Segments in the 2008 financial year, the standardrequires a “management approach”, under which segment information is presented on the same basisas that used for internal reporting to the chief operating decision maker (“CODM”).
The Group has only one product, being gold. In order to determine operating and reportablesegments, management reviewed various factors, including geographical location as well asmanagerial structure. It was determined that an operating segment consists of a shaft or a group ofshafts managed by a single general manager and management team.
After applying the quantitative thresholds from the standard, the reportable segments weredetermined as:
Tshepong, Phakisa, Bambanani, Masimong, Target, Doornkop, Elandskraal, Evander operations, Virginiaoperations, Cooke operations (held for sale and discontinued) and Papua New Guinea. All otheroperating segments have been grouped together under other — underground or other — surface, undertheir classification as either continuing or discontinued.
The comparative segment reports have been restated for these changes.
When assessing profitability, the CODM considers the revenue and production costs of each segment.The net of these amounts is the cash operating or loss. Therefore, cash operating profit has beendisclosed in the segment report as the measure of profit or loss.
The CODM does not consider depreciation or impairment and therefore these amounts have not beendisclosed in the segment report.
Segment assets consist of mining assets which can be attributed to the shaft or group of shafts.Items such as trade and other receivables and investments in financial assets are not allocated ata shaft or group of shafts’ level and therefore form part of the reconciliation to total assets.
A reconciliation of the segment totals to the Group financial statements has been included innote 41.
F-61
Segment report
For the year ended June 30, 2008
| | | | | | | | | | | | | | | | | | | | | | | | | | | | | | |
| | | | | | | Cash | | | Cash | | | | | | | | | | | | | | |
| | | | | | | operating | | | operating | | | Mining | | | Capital | | | | | | | | |
| | | Revenue | | | cost | | | profit | | | assets | | | expenditure | | | | Ounces* | | | Tons milled* | |
| | | Figures in million (US Dollar) | | | | | | | | t’000 | |
| | | | |
| | | | | | | | | | | | | | | | | | | | | | | | | | | | | |
Continuing operations | | | | | | | | | | | | | | | | | | | | | | | | | | | | | |
| | | | | | | | | | | | | | | | | | | | | | | | | | | | | |
South Africa | | | | | | | | | | | | | | | | | | | | | | | | | | | | | |
| | | | | | | | | | | | | | | | | | | | | | | | | | | | | |
Underground | | | | | | | | | | | | | | | | | | | | | | | | | | | | | |
Tshepong | | | 223 | | | | 125 | | | | 98 | | | | 404 | | | | 27 | | | | | 273,119 | | | | 1,649 | |
Phakisa | | | 4 | | | | 2 | | | | 2 | | | | 312 | | | | 40 | | | | | 4,212 | | | | 34 | |
Bambanani | | | 128 | | | | 102 | | | | 26 | | | | 98 | | | | 15 | | | | | 158,985 | | | | 912 | |
Doornkop | | | 35 | | | | 31 | | | | 4 | | | | 273 | | | | 48 | | | | | 44,143 | | | | 494 | |
Elandsrand | | | 133 | | | | 103 | | | | 30 | | | | 304 | | | | 44 | | | | | 158,631 | | | | 981 | |
Target | | | 69 | | | | 51 | | | | 18 | | | | 275 | | | | 35 | | | | | 85,006 | | | | 686 | |
Masimong | | | 96 | | | | 88 | | | | 8 | | | | 94 | | | | 16 | | | | | 117,575 | | | | 892 | |
Evander operations | | | 193 | | | | 127 | | | | 66 | | | | 131 | | | | 33 | | | | | 240,037 | | | | 1,447 | |
Virginia operations | | | 204 | | | | 180 | | | | 24 | | | | 107 | | | | 20 | | | | | 250,324 | | | | 2,349 | |
Other operations | | | 58 | | | | 52 | | | | 6 | | | | 29 | | | | 6 | | | | | 69,574 | | | | 535 | |
| | | | | | | | | | | | | | | | | | | | | | | | | | | | | |
Surface | | | | | | | | | | | | | | | | | | | | | | | | | | | | | |
Other operations | | | 126 | | | | 57 | | | | 69 | | | | 19 | | | | 19 | | | | | 148,921 | | | | 9,524 | |
| | | | |
Total South Africa | | | 1,269 | | | | 918 | | | | 351 | | | | 2,046 | | | | 303 | | | | | 1,550,527 | | | | 19,503 | |
| | | | |
| | | | | | | | | | | | | | | | | | | | | | | | | | | | | |
International | | | | | | | | | | | | | | | | | | | | | | | | | | | | | |
| | | | | | | | | | | | | | | | | | | | | | | | | | | | | |
Papua New Guinea | | | — | | | | — | | | | — | | | | 580 | | | | 197 | | | | | — | | | | — | |
| | | | |
Total international | | | — | | | | — | | | | — | | | | 580 | | | | 197 | | | | | — | | | | — | |
| | | | |
Total continuing operations | | | 1,269 | | | | 918 | | | | 351 | | | | 2,626 | | | | 500 | | | | | 1,550,527 | | | | 19,503 | |
| | | | |
| | | | | | | | | | | | | | | | | | | | | | | | | | | | | |
Discontinued operations | | | | | | | | | | | | | | | | | | | | | | | | | | | | | |
| | | | | | | | | | | | | | | | | | | | | | | | | | | | | |
Cooke operations | | | 194 | | | | 123 | | | | 71 | | | | 86 | | | | 22 | | | | | 236,242 | | | | 3,906 | |
Other operations | | | 115 | | | | 107 | | | | 8 | | | | 66 | | | | 20 | | | | | 162,007 | | | | 2,014 | |
| | | | |
Total discontinued operations | | | 309 | | | | 230 | | | | 79 | | | | 152 | | | | 42 | | | | | 398,249 | | | | 5,920 | |
| | | | |
Total operations | | | 1,578 | | | | 1,148 | | | | 430 | | | | 2,778 | | | | 542 | | | | | 1,948,776 | | | | 25,423 | |
| | | | |
| | | | | | | | | | | | | | | | | | | | | | | | | | | | | |
Reconciliation of segmentdata to consolidatedfinancial statements (refernote 41):
| | | | | | | | | | | | | | | | | | | | | | | | | | | | | | |
| | | (309 | ) | | | (230 | ) | | | | | | 1,932 | | | | | | | | | | | | | | |
| | | | |
| | | 1,269 | | | | 918 | | | | | | | 4,710 | | | | | | | | | | | | | | |
| | | | |
| | |
| * | | Production statistics are unaudited |
F-62
Segment report
For the year ended June 30, 2007
| | | | | | | | | | | | | | | | | | | | | | | | | | | | | | |
| | | | | | | Cash | | | Cash | | | | | | | | | | | | | | |
| | | | | | | operating | | | operating | | | Mining | | | Capital | | | | | | | | |
| | | Revenue | | | cost | | | profit | | | assets | | | expenditure | | | | Ounces* | | | Tons milled* | |
| | | Figures in million (US Dollar) | | | | | | | | t’000 | |
| | | | |
| | | | | | | | | | | | | | | | | | | | | | | | | | | | | |
Continuing operations | | | | | | | | | | | | | | | | | | | | | | | | | | | | | |
| | | | | | | | | | | | | | | | | | | | | | | | | | | | | |
South Africa | | | | | | | | | | | | | | | | | | | | | | | | | | | | | |
| | | | | | | | | | | | | | | | | | | | | | | | | | | | | |
Underground | | | | | | | | | | | | | | | | | | | | | | | | | | | | | |
Tshepong | | | 203 | | | | 112 | | | | 91 | | | | 442 | | | | 26 | | | | | 318,887 | | | | 1,824 | |
Phakisa | | | — | | | | — | | | | — | | | | 303 | | | | 32 | | | | | — | | | | — | |
Bambanani | | | 126 | | | | 115 | | | | 11 | | | | 105 | | | | 17 | | | | | 197,060 | | | | 1,283 | |
Doornkop | | | 37 | | | | 25 | | | | 12 | | | | 247 | | | | 38 | | | | | 57,364 | | | | 597 | |
Elandsrand | | | 124 | | | | 103 | | | | 21 | | | | 299 | | | | 33 | | | | | 194,710 | | | | 1,117 | |
Target | | | 91 | | | | 53 | | | | 38 | | | | 287 | | | | 16 | | | | | 142,433 | | | | 904 | |
Masimong | | | 95 | | | | 82 | | | | 13 | | | | 79 | | | | 15 | | | | | 147,958 | | | | 1,074 | |
Evander operations | | | 151 | | | | 113 | | | | 38 | | | | 143 | | | | 28 | | | | | 235,443 | | | | 1,667 | |
Virginia operations | | | 172 | | | | 147 | | | | 25 | | | | 67 | | | | 19 | | | | | 266,948 | | | | 2,507 | |
Other operations | | | 65 | | | | 51 | | | | 14 | | | | 28 | | | | 6 | | | | | 104,507 | | | | 770 | |
| | | | | | | | | | | | | | | | | | | | | | | | | | | | | |
Surface | | | | | | | | | | | | | | | | | | | | | | | | | | | | | |
Other operations | | | 52 | | | | 35 | | | | 17 | | | | 66 | | | | 17 | | | | | 81,761 | | | | 4,557 | |
| | | | |
Total South Africa | | | 1,116 | | | | 836 | | | | 280 | | | | 2,066 | | | | 247 | | | | | 1,747,071 | | | | 16,300 | |
| | | | |
| | | | | | | | | | | | | | | | | | | | | | | | | | | | | |
International | | | | | | | | | | | | | | | | | | | | | | | | | | | | | |
| | | | | | | | | | | | | | | | | | | | | | | | | | | | | |
Papua New Guinea | | | — | | | | — | | | | — | | | | 320 | | | | 73 | | | | | — | | | | — | |
| | | | |
Total international | | | — | | | | — | | | | — | | | | 320 | | | | 73 | | | | | — | | | | — | |
| | | | |
Total continuing operations | | | 1,116 | | | | 836 | | | | 280 | | | | 2,386 | | | | 320 | | | | | 1,747,071 | | | | 16,300 | |
| | | | |
| | | | | | | | | | | | | | | | | | | | | | | | | | | | | |
Discontinued operations | | | | | | | | | | | | | | | | | | | | | | | | | | | | | |
| | | | | | | | | | | | | | | | | | | | | | | | | | | | | |
Cooke operations | | | 154 | | | | 118 | | | | 36 | | | | 72 | | | | 19 | | | | | 243,219 | | | | 2,327 | |
Other operations | | | 219 | | | | 180 | | | | 39 | | | | 125 | | | | 42 | | | | | 343,908 | | | | 4,213 | |
| | | | |
Total discontinued operations | | | 373 | | | | 298 | | | | 75 | | | | 197 | | | | 61 | | | | | 587,127 | | | | 6,540 | |
| | | | |
Total operations | | | 1,489 | | | | 1,134 | | | | 355 | | | | 2,583 | | | | 381 | | | | | 2,334,198 | | | | 22,840 | |
| | | | |
| | | | | | | | | | | | | | | | | | | | | | | | | | | | | |
Reconciliation of segmentdata to consolidatedfinancial statements (refernote 41):
| | | | | | | | | | | | | | | | | | | | | | | | | | | | | | |
| | | ( 373 | ) | | | (298 | ) | | | | | | 2,577 | | | | | | | | | | | | | | |
| | | | |
| | | 1,116 | | | | 836 | | | | | | | 5,160 | | | | | | | | | | | | | | |
| | | | |
| | |
| * | | Production statistics are unaudited |
F-63
Segment report
For the year ended June 30, 2006
| | | | | | | | | | | | | | | | | | | | | | | | | | | | | | |
| | | | | | | Cash | | | Cash | | | | | | | | | | | | | | |
| | | | | | | Operating | | | Operating | | | Mining | | | Capital | | | | | | | | |
| | | Revenue | | | cost | | | profit | | | assets | | | expenditure | | | | Ounces* | | | Tons milled* | |
| | | | |
| | | Figures in million (US Dollar) | | | | | | | | t’000 | |
| | | | |
| | | | | | | | | | | | | | | | | | | | | | | | | | | | | |
Continuing operations | | | | | | | | | | | | | | | | | | | | | | | | | | | | | |
| | | | | | | | | | | | | | | | | | | | | | | | | | | | | |
South Africa | | | | | | | | | | | | | | | | | | | | | | | | | | | | | |
| | | | | | | | | | | | | | | | | | | | | | | | | | | | | |
Underground | | | | | | | | | | | | | | | | | | | | | | | | | | | | | |
Tshepong | | | 180 | | | | 111 | | | | 69 | | | | 430 | | | | 21 | | | | | 335,289 | | | | 1,786 | |
Phakisa | | | — | | | | — | | | | — | | | | 264 | | | | 23 | | | | | — | | | | — | |
Bambanani | | | 106 | | | | 101 | | | | 5 | | | | 107 | | | | 14 | | | | | 200,739 | | | | 1,402 | |
Doornkop | | | 23 | | | | 24 | | | | (1 | ) | | | 203 | | | | 26 | | | | | 43,593 | | | | 515 | |
Elandsrand | | | 90 | | | | 89 | | | | 1 | | | | 264 | | | | 31 | | | | | 170,867 | | | | 987 | |
Target | | | 81 | | | | 52 | | | | 29 | | | | 280 | | | | 10 | | | | | 150,196 | | | | 813 | |
Masimong | | | 73 | | | | 67 | | | | 6 | | | | 65 | | | | 14 | | | | | 136,153 | | | | 1,020 | |
Evander operations | | | 142 | | | | 111 | | | | 31 | | | | 120 | | | | 26 | | | | | 274,439 | | | | 1,700 | |
Virginia operations | | | 146 | | | | 135 | | | | 11 | | | | 51 | | | | 14 | | | | | 276,285 | | | | 2,368 | |
Other operations | | | 42 | | | | 42 | | | | — | | | | 16 | | | | 4 | | | | | 77,652 | | | | 599 | |
| | | | | | | | | | | | | | | | | | | | | | | | | | | | | |
Surface | | | | | | | | | | | | | | | | | | | | | | | | | | | | | |
Other operations | | | 54 | | | | 46 | | | | 8 | | | | 48 | | | | 7 | | | | | 104,738 | | | | 3,445 | |
| | | | |
Total South Africa | | | 937 | | | | 778 | | | | 159 | | | | 1,848 | | | | 190 | | | | | 1,769,951 | | | | 14,635 | |
| | | | |
| | | | | | | | | | | | | | | | | | | | | | | | | | | | | |
International | | | | | | | | | | | | | | | | | | | | | | | | | | | | | |
| | | | | | | | | | | | | | | | | | | | | | | | | | | | | |
Papua New Guinea | | | — | | | | — | | | | — | | | | 213 | | | | 15 | | | | | — | | | | — | |
| | | | |
Total international | | | — | | | | — | | | | — | | | | 213 | | | | 15 | | | | | — | | | | — | |
| | | | |
Total continuing operation | | | 937 | | | | 778 | | | | 159 | | | | 2,061 | | | | 205 | | | | | 1,769,951 | | | | 14,635 | |
| | | | |
| | | | | | | | | | | | | | | | | | | | | | | | | | | | | |
Discontinued operations | | | | | | | | | | | | | | | | | | | | | | | | | | | | | |
| | | | | | | | | | | | | | | | | | | | | | | | | | | | | |
Cooke operations | | | 137 | | | | 102 | | | | 35 | | | | 58 | | | | 25 | | | | | 256,739 | | | | 2,034 | |
Other operations | | | 190 | | | | 156 | | | | 34 | | | | 157 | | | | 35 | | | | | 360,235 | | | | 4,151 | |
| | | | |
Total discontinued operations | | | 327 | | | | 258 | | | | 69 | | | | 215 | | | | 60 | | | | | 616,974 | | | | 6,185 | |
| | | | |
Total operations | | | 1,264 | | | | 1,036 | | | | 228 | | | | 2,276 | | | | 265 | | | | | 2,386,925 | | | | 20,820 | |
| | | | |
| | | | | | | | | | | | | | | | | | | | | | | | | | | | | |
| | | | | | | | | | | | | | | | | | | | | | | | | | | | | |
Reconciliation of segmentdata to consolidatedfinancial statements (refernote 41): |
| | | ( 327 | ) | | | (258 | ) | | | | | | | 2,419 | | | | | | | | | | | | | | |
| | | 937 | | | | 778 | | | | | | | | 4,695 | | | | | | | | | | | | | | |
| | | | |
| | |
| * | | Production statistics are unaudited |
F-64
| 41 | | Reconciliation of segment information to consolidated income statements and balance sheet: |
| | | | | | | | | | | | | |
| | | US Dollar | |
| |
| Figures in million | | 2008 | | | 2007 | | | 2006 | |
| |
| | | | | | | | | | | | |
The “reconciliation of segmentdata to consolidated financials”line item in the segment reportsare broken down in the followingelements, to give a betterunderstanding of the differencesbetween the income statement,balance sheet and the segmentreport. | | | | | | | | | | | | |
| | | | | | | | | | | | |
Revenue from: | | | | | | | | | | | | |
Discontinued operations | | | 309 | | | | 373 | | | | 327 | |
| |
| | | | | | | | | | | | |
Production costs from: | | | | | | | | | | | | |
Discontinued operations | | | 230 | | | | 298 | | | | 258 | |
| |
| | | | | | | | | | | | | |
| | | US Dollar | |
| |
| Figures in million | | 2008 | | | 2007 | | | 2006 | |
| |
| | | | | | | | | | | | |
Reconciliation of cash operatingprofit to consolidated lossbefore taxation and discontinuedoperations: | | | | | | | | | | | | |
Total segment revenue | | | 1,578 | | | | 1,489 | | | | 1,264 | |
Total segment production costs | | | (1,148 | ) | | | (1,134 | ) | | | (1,036 | ) |
| |
Cash operating profit | | | 430 | | | | 355 | | | | 228 | |
Less discontinued operations | | | (79 | ) | | | (75 | ) | | | (69 | ) |
| |
| | | 351 | | | | 280 | | | | 159 | |
Cost of sales items other thanproduction costs | | | (204 | ) | | | (93 | ) | | | (131 | ) |
| |
Amortization and depreciation ofmining properties, minedevelopment cost and mine plantfacilities | | | (106 | ) | | | (102 | ) | | | (129 | ) |
Amortization and depreciation ofother than mining properties,mine development cost and mineplant facilities | | | (11 | ) | | | (4 | ) | | | (9 | ) |
Provision/(reversal of provision)for rehabilitation cost | | | (1 | ) | | | 6 | | | | 3 | |
Care and maintenance cost ofrestructured shafts | | | (10 | ) | | | (8 | ) | | | (22 | ) |
Employment termination andrestructuring costs | | | (29 | ) | | | — | | | | 12 | |
Share-based payments | | | (6 | ) | | | (6 | ) | | | (15 | ) |
Impairment/(reversal ofimpairment) of assets | | | (40 | ) | | | 19 | | | | 30 | |
Provision for post retirementbenefits | | | (1 | ) | | | 2 | | | | (1 | ) |
| |
| | | 147 | | | | 187 | | | | 28 | |
Corporate, administration andother expenditure | | | (31 | ) | | | (31 | ) | | | (24 | ) |
Exploration expenditure | | | (28 | ) | | | (27 | ) | | | (11 | ) |
Other expenses/income | | | (15 | ) | | | 25 | | | | (97 | ) |
| |
Operating profit | | | 73 | | | | 154 | | | | (104 | ) |
Loss from associate | | | (11 | ) | | | (3 | ) | | | (17 | ) |
Profit on sale of investment inassociate | | | — | | | | 33 | | | | — | |
Impairment of investment inassociate | | | (12 | ) | | | — | | | | — | |
Profit on sale of investment insubsidiary | | | — | | | | — | | | | 2 | |
Fair value of non-derivativefinancial instruments | | | 5 | | | | 15 | | | | 14 | |
Loss on sale of listed investments | | | (63 | ) | | | (5 | ) | | | 45 | |
Investment income | | | 39 | | | | 27 | | | | 31 | |
Finance cost | | | (70 | ) | | | (65 | ) | | | (62 | ) |
| |
| | | | | | | | | | | | |
(Loss)/profit before taxation anddiscontinued operations | | | (39 | ) | | | 156 | | | | (91 | ) |
| |
F-65
| | | | | | | | | | | | | |
| | | US Dollar | |
| |
| Figures in million | | 2008 | | | 2007 | | | 2006 | |
| |
| | | | | | | | | | | | |
Reconciliation of total segmentassets to consolidated assetsincludes the following: | | | | | | | | | | | | |
| | | | | | | | | | | | |
Non-current assets | | | | | | | | | | | | |
| | | | | | | | | | | | |
Property, plant and equipment notallocated to a segment | | | 906 | | | | 1,026 | | | | 987 | |
Intangible assets | | | 283 | | | | 328 | | | | 316 | |
Restricted cash | | | 10 | | | | 1 | | | | 36 | |
Restricted investments | | | 188 | | | | 195 | | | | 184 | |
Investment in financial assets | | | 9 | | | | 8 | | | | 137 | |
Investments in associates | | | 19 | | | | 1 | | | | 266 | |
Deferred tax asset | | | 190 | | | | 216 | | | | 194 | |
Trade and other receivables | | | 18 | | | | 8 | | | | 8 | |
| | | | | | | | | | | | |
Current assets | | | | | | | | | | | | |
| | | | | | | | | | | | |
Inventories | | | 89 | | | | 105 | | | | 93 | |
Investment in financial assets | | | — | | | | 353 | | | | — | |
Trade and other receivables | | | 112 | | | | 130 | | | | 103 | |
Income and mining taxes | | | 11 | | | | 9 | | | | 4 | |
Restricted cash | | | — | | | | 39 | | | | — | |
Cash and cash equivalents | | | 53 | | | | 101 | | | | 91 | |
Non-current assets classified asheld-for-sale excluding miningassets | | | 44 | | | | 57 | | | | — | |
| |
| | | 1,932 | | | | 2,577 | | | | 2,419 | |
| |
F-66